This is a practice model and I'm stuck on the statistics collectors, I want to get a piechart of all of my "Computador" process that shows idle and process time. I tried choosing the fixed resource in the 3d model and pinning the State statistic, (like in the basic tutorial) but it does not work. All of those "Computador#" process are in a group and this group is a Resource (Shared Asset) in my flowchart. Any help would be awesome.. Sorry for my english... Thanks!
With resources, there are two kinds of statistics that people try to calculate for a pie chart:
- Acquired time vs available time
- Time in use vs idle time
In some situations, these numbers are very different. For example, in a hotel, a guest reserves a room long before they arrive at the room. In other situations, these two times are more similar, like a person waiting in line to acquire a service desk; they acquire the resource and then use it almost immediately.
It sounds, though, like you are interested in getting the time in use vs idle time. In your model right now, there is nothing that actually uses the machines in your model. They are acquired, and customers walk to them and wait next to them, but nothing actually happens to the machine to let it know it's being used. This is why, if you look at a state chart for the machines, they stay idle the whole time.
The solution is to change your model, so that the machines change state while they are in use. The easiest way to do that is using a Custom Code activity to set the state of your machines.
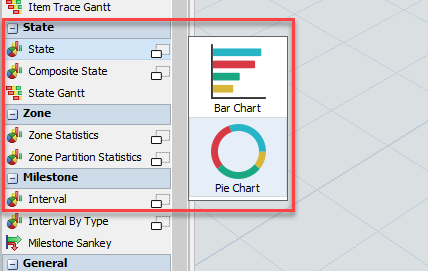
Once you do that, you can look at making a chart. In the Dashboard Library, there is a Composite State Pie chart you can create:
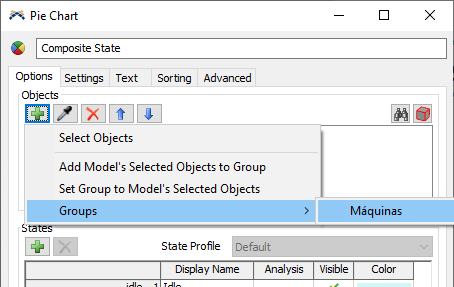
Once you make that chart, just add the group of machines:
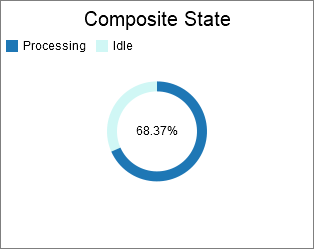
And that should get you the chart you need. The Composite State Pie averages the state values of all objects in the chart:
@jordan.johnson Thank you so much! Very helpful!
10 People are following this question.
