About the Distribution Chooser
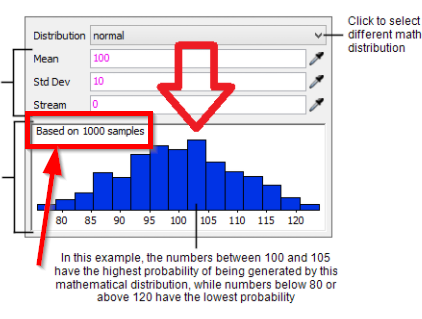
Since it is a normal distribution, I think that the peak in the center is the highest in the histogram.
However, in the Distribution Chooser, the mountain on the right side of the center is the highest.
Why is this?
About the Distribution Chooser
Since it is a normal distribution, I think that the peak in the center is the highest in the histogram.
However, in the Distribution Chooser, the mountain on the right side of the center is the highest.
Why is this?
The graph is made from a small sample from the distribution, so are not calculated.
21 People are following this question.
FlexSim can help you understand and improve any system or process. Transform your existing data into accurate predictions.
FlexSim is a fully 3D simulation software environment. FlexSim can be used to simulate any process in any industry.
FlexSim®, FlexSim Healthcare™, Problem Solved.®, the FlexSim logo, the FlexSim X-mark, and the FlexSim Healthcare logo with stylized Caduceus mark are trademarks of FlexSim Software Products, Inc. All rights reserved.
May we collect and use your data?
Learn more about the Third Party Services we use and our Privacy Statement.May we collect and use your data to tailor your experience?
Explore the benefits of a customized experience by managing your privacy settings for this site or visit our Privacy Statement to learn more about your options.
