question

Laquerius77 avatar image
0 Likes"
Laquerius77 asked Laquerius77 commented

Experimenter: Varying Number of Loadport

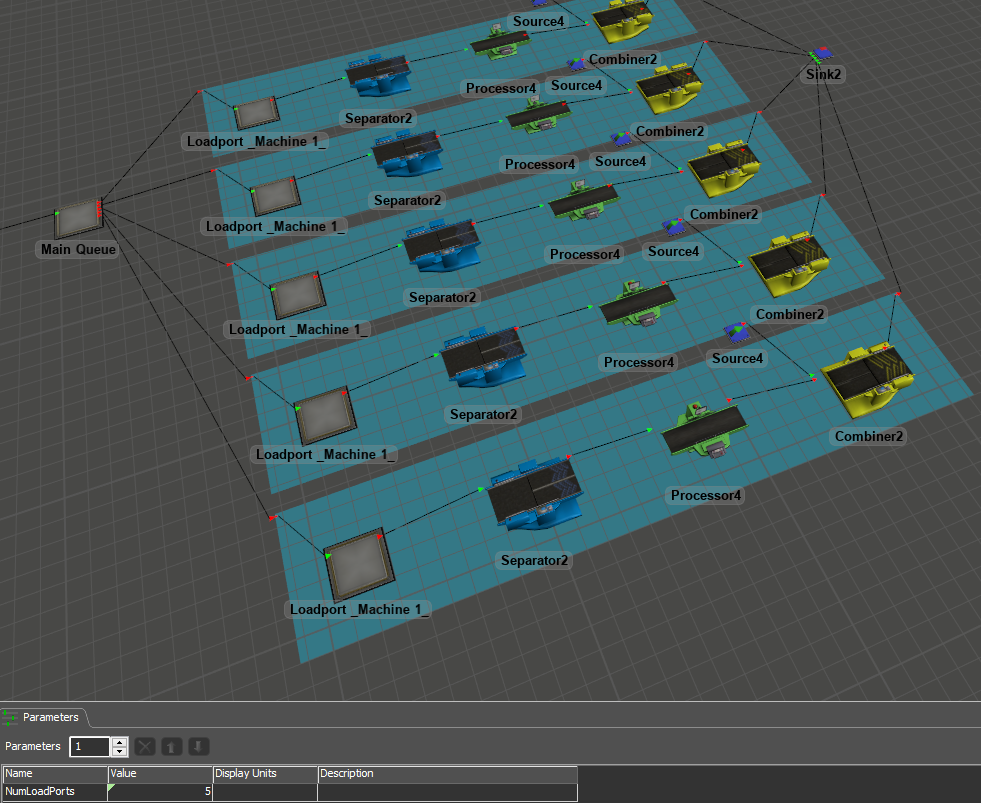
Hi everyone, so basically, I need to replicate the model attached and test for varying number of loadport (which is the queue - as named in the model). I do believe the way to go is using experimenter. I tried to create the underlying parameter to vary the number of loadport but, am not really sure when it comes to setting up the performance measures.


I basically need to simulate

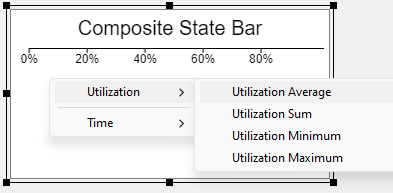
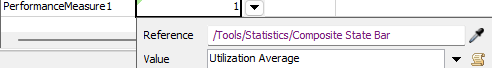
the state of all of the processors as a whole (Performance Measure #1) + number of items processed (basically number of items received at the sink) (Performance Measure #2)


I would appreciate any help and thanks a lot in advanced! :)


Flexsim_Iteration_OneLoadportOneTester_autosave.fsm

FlexSim 22.0.7
experimenterparametersperformance measures
5 |100000

Up to 12 attachments (including images) can be used with a maximum of 23.8 MiB each and 47.7 MiB total.

1 Answer

·
Jason Lightfoot avatar image
0 Likes"
Jason Lightfoot answered Laquerius77 commented

Here's an approach using a container for the load port (which I assume is all 4 objects per port), which is added to a group for the parameter to know what to create.

The problem was that the internal connections are not preserved by the standard OnSet logic, so I've altered that so it works.

1679251549582.png

I also added a performance measure for the processed items.


flexsim-loadPorts_jl.fsm


· 4
5 |100000

Up to 12 attachments (including images) can be used with a maximum of 23.8 MiB each and 47.7 MiB total.

Laquerius77 avatar image Laquerius77 commented ·
Hi Jason, initially the way I model the loadport is that the first queue of each lane will be the loadport but, I have modified the model and I am able to use your answer. Thanks a lot for the help!
0 Likes 0 ·
Laquerius77 avatar image Laquerius77 Laquerius77 commented ·
Hi @Jason Lightfoot would you also be able to help me with adding another performance measure for the state of all the processors/utilization rate?
0 Likes 0 ·
Felix Möhlmann avatar image Felix Möhlmann Laquerius77 commented ·

Since there is already a Composite State Bar chart on the dashboard, just use the sampling tool of the Reference field to get the utilization as a performance measure.

1679382367133.png

1679382433290.png

0 Likes 0 ·
1679382367133.png (11.0 KiB)
1679382433290.png (6.1 KiB)
Show more comments

Write an Answer

Hint: Notify or tag a user in this post by typing @username.

Up to 12 attachments (including images) can be used with a maximum of 23.8 MiB each and 47.7 MiB total.