I have some model about healthcare I want to track. that How many patient incoming into system, Show graph line plot (X-axis time, Y-Axis Number of patients) track waiting time and How many patients out of system? I don't know how to make a dashboard.
You can add a new dashboard to the model in the toolbox or the menu bar at the top.

When you click into the dashboard window, the library changes to display pre-defined chart types which cover a lot of use cases. The things you describe would be covered by a Census vs. Time chart (click on census and then on line chart), an Avg Staytime or Avg Wait Time for Location chart (depending on what exactly you want to measure, time spend in a waiting room and time spend waiting for a treatment room might be same value) and a Model Throughput Chart.
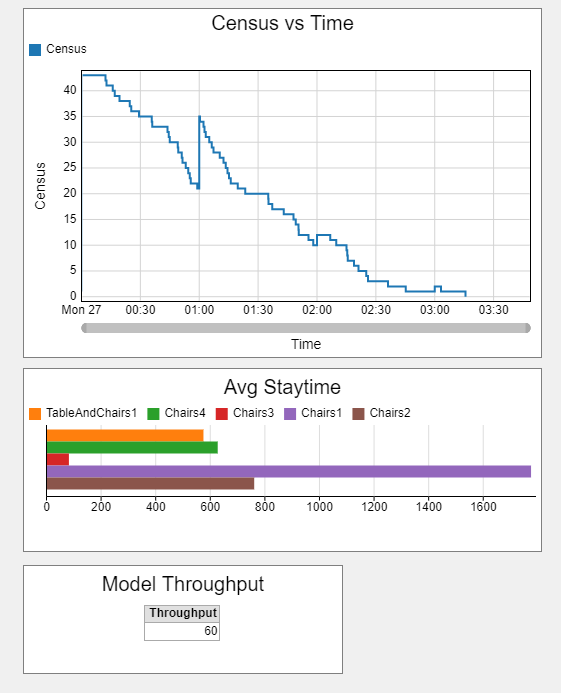
In the screenshot (from the attached model), I configured the Avg Staytime chart to partition the data by location. By default the chart would show the average staytime across all locations and patients. You can also partition by different values, for example to get the staytime for each patient.
14 People are following this question.
