question

GOMARCOO avatar image
0 Likes"
GOMARCOO asked GOMARCOO answered

Bar Chart of groups with an average value from the labels.


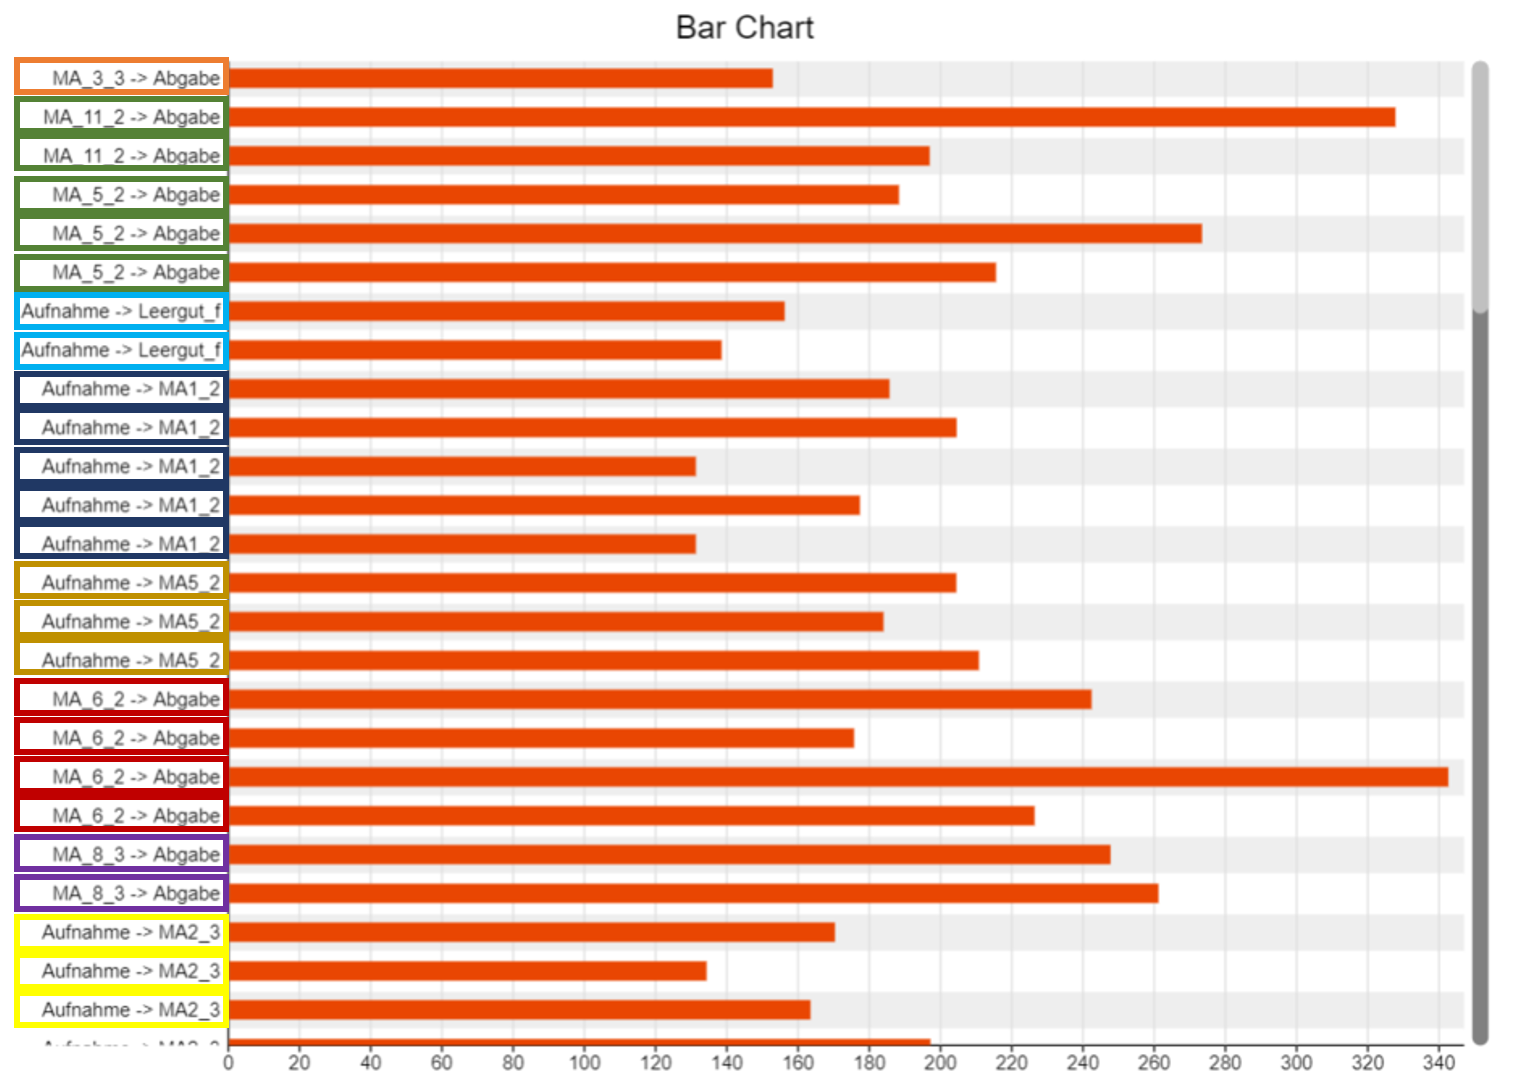
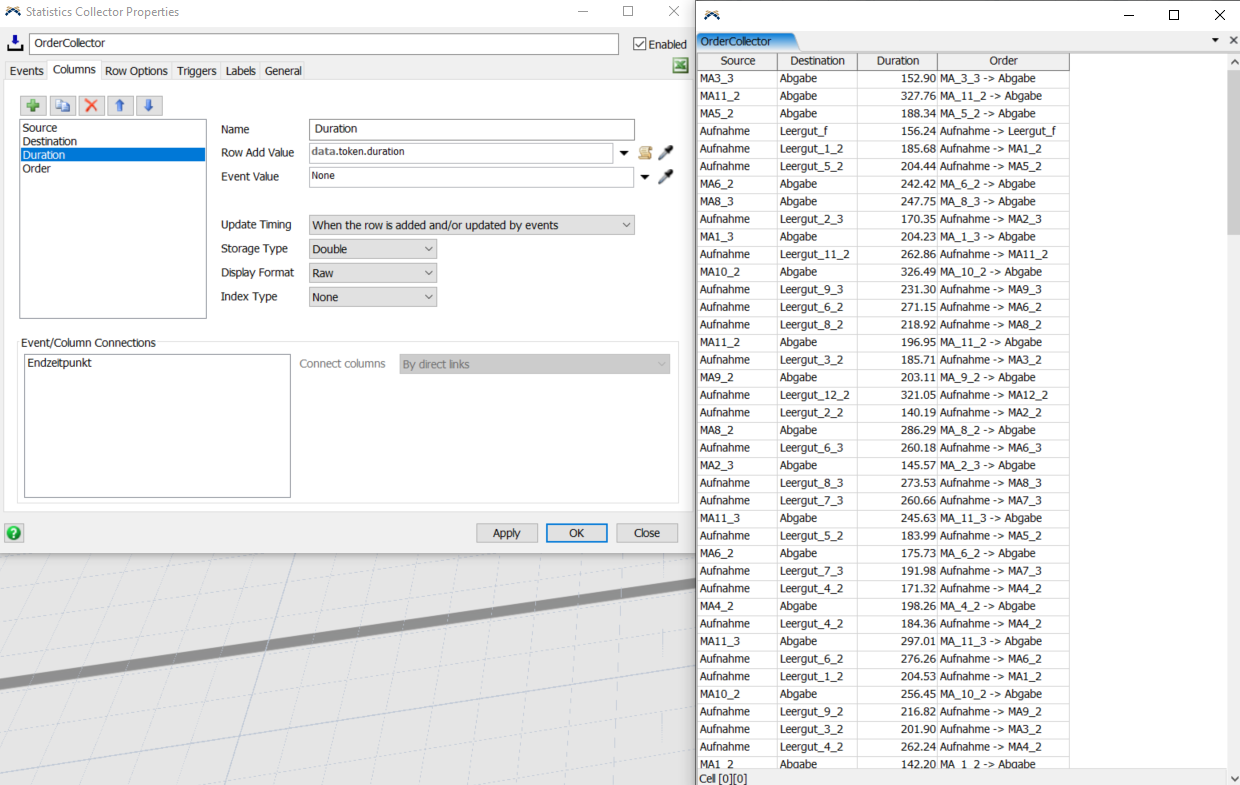
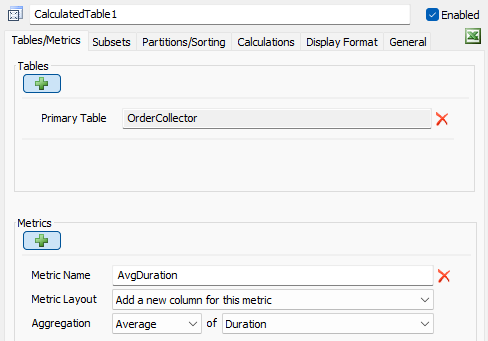
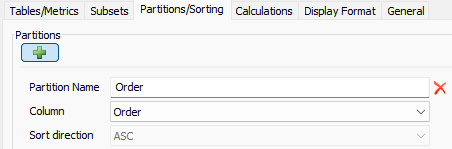
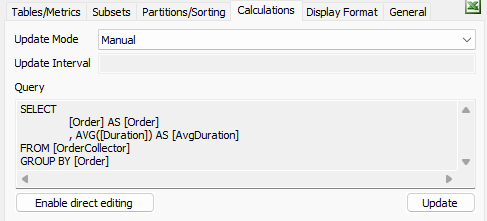
Is it possible, to get my data in groups and take the average value of it? I do have around 70 Groups of Transports which are repeating continuously. I want to figure out the average of each Transport. and not every transport in one bar chart. The data from the barchart are from a statistics collector who tracks the labels.


1706704510144.png

1706704818094.png


FlexSim 24.0.1
agvstatistics collector
1706704510144.png (255.9 KiB)
1706704818094.png (380.6 KiB)
5 |100000

Up to 12 attachments (including images) can be used with a maximum of 23.8 MiB each and 47.7 MiB total.

Felix Möhlmann avatar image
0 Likes"
Felix Möhlmann answered

Calculated Tables are used to aggregate table data using SQL.

In your case the settings would look like this:

1706706077183.png

1706706090309.png

This results in the query you see below. If you have knowledge of SQL you can also "enable direct editing" and type the query yourself.

1706706134175.png

A Calculated Table can be used as a data source for charts just like a Statistics Collector.


1706706077183.png (19.3 KiB)
1706706090309.png (9.0 KiB)
1706706134175.png (13.6 KiB)
5 |100000

Up to 12 attachments (including images) can be used with a maximum of 23.8 MiB each and 47.7 MiB total.

GOMARCOO avatar image
0 Likes"
GOMARCOO answered

Thanks for your Answer. It helped me a lot!

5 |100000

Up to 12 attachments (including images) can be used with a maximum of 23.8 MiB each and 47.7 MiB total.

Write an Answer

Hint: Notify or tag a user in this post by typing @username.

Up to 12 attachments (including images) can be used with a maximum of 23.8 MiB each and 47.7 MiB total.