question

Cindy Azuero avatar image
1 Like"
Cindy Azuero asked Aurélien FR commented

I can't access dashboard statistics from experimenter

I cannot find my dashboard statistics on the Experimenter. What can I do?

FlexSim 17.2.2
experimenterperformance measuresdashboard statistics
5 |100000

Up to 12 attachments (including images) can be used with a maximum of 23.8 MiB each and 47.7 MiB total.

Jordan Johnson avatar image
2 Likes"
Jordan Johnson answered Aurélien FR commented

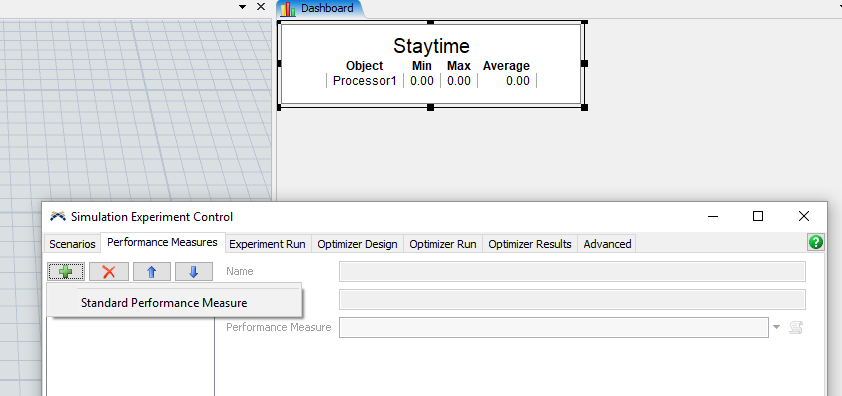
To use Statistics Collector data (or Calculated Table data) as a performance measure, you will need to use a standard performance measure, and write a snippet of code for the value:

Table("MyStatsCollector")[row][col]

We do want to make this process easier, and a future version will have a pick option for these value.

· 3
5 |100000

Up to 12 attachments (including images) can be used with a maximum of 23.8 MiB each and 47.7 MiB total.

laetitia thomas avatar image laetitia thomas commented ·

Hi @jordan.johnson,

I'm using version 18.0.2, and there is no pick option available yet.

Do you know when this option will be implemented ?

1 Like 1 ·
Jordan Johnson avatar image Jordan Johnson ♦♦ laetitia thomas commented ·

It depends on how quickly I can finish the other improvements I am making to the charts. It could be released as early as version 2018 Update 1, but I may not be able to get to it until version 2018 Update 2 or later. It is on my list, and it is something that many users have requested, so it is something i would like to get done.

2 Likes 2 ·
Aurélien FR avatar image Aurélien FR Jordan Johnson ♦♦ commented ·

This option is really needed, the current performance measure is quite restrictive. Having to duplicate the dashboard to a performance measure with less flexibility is a big loss of efficiency.

0 Likes 0 ·
Arun Kr avatar image
1 Like"
Arun Kr answered Jordan Johnson commented

Hi @Cindy Azuero,

You must check "save dashboard data for each replication to view the dashboard statistics in the experimenter. Also, you can only see the dashboard statistics using view results button.


exp.png (34.3 KiB)
· 4
5 |100000

Up to 12 attachments (including images) can be used with a maximum of 23.8 MiB each and 47.7 MiB total.

Cindy Azuero avatar image Cindy Azuero commented ·

I don't want to see the dashboard on view results but to be able to define a dashboard statistic as a performance measure as it was possible on previous versions of the software.

0 Likes 0 ·
Arun Kr avatar image Arun Kr Cindy Azuero commented ·

Hi Cindy Azuero,

If you use legacy dashboards, the statistic can be added as a part of performance measure. I don't think the new dashboards which use statistic collectors is having an option as you mentioned. @jordan.johnson please share your input.

Regards,

Arun KR

2 Likes 2 ·
Cindy Azuero avatar image Cindy Azuero Arun Kr commented ·

Yes, I need to know if it is possible to use the this new method (statistic collector+ dashboard) with the experimenter because if not, it is necessary to use always the legacy dashboards to do statistical analysis on the results. Also, if you can't do this, the statistic collector+ dashboard is limited to analysis on only one replication. So, it's there a way to create performance measures based on statistic collector+dashboard? or the only way is with legacy dashboards?

0 Likes 0 ·
Jordan Johnson avatar image Jordan Johnson ♦♦ commented ·

You don't need to make a chart, or "save dashboard data" to get performance measures from a Statistics Collector. Statistics Collector data is saved during an experiment, whether you check that box or not.

0 Likes 0 ·

Write an Answer

Hint: Notify or tag a user in this post by typing @username.

Up to 12 attachments (including images) can be used with a maximum of 23.8 MiB each and 47.7 MiB total.