I'm simulating a restaurant and i'm using a queue to simulate the eaiting line.The option "Wait for transport" doesn't work and it doesn't appear the option "staytime". There is another option to do that ?
How to create a pie chart for a queue to measure the the wait time?
FlexSim 21.1.5
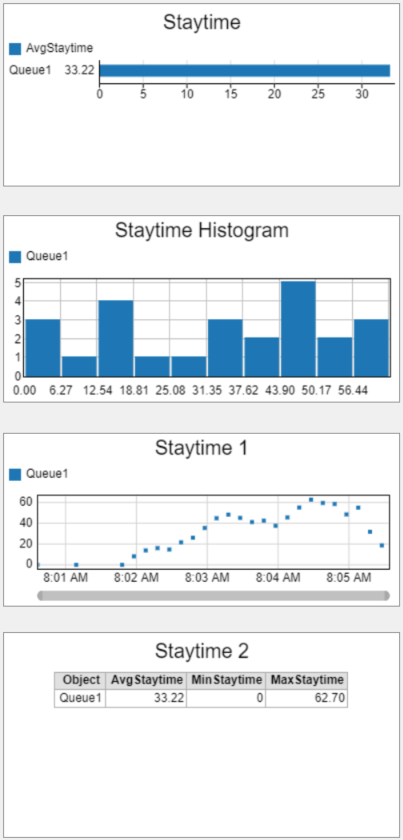
Hey @Ines Rodrigues. A Pie Chart is not a good way to represent a measurement of time, I suggest using one of the other options for Staytime. By default, there's a Bar Graph, Histogram, Line/Dot Graph, and Chart. If there are other parameters or things you want to measure (like comparing the time the queue has something vs. the time it's empty), then maybe a pie graph would work. But for just measuring staytime, I recommend one of these (below).
18 People are following this question.
