question

Ankur A3 avatar image
0 Likes"
Ankur A3 asked Ankur A3 commented

How To Filter Data On Dashboard While using Time Plot?

Hi Team,

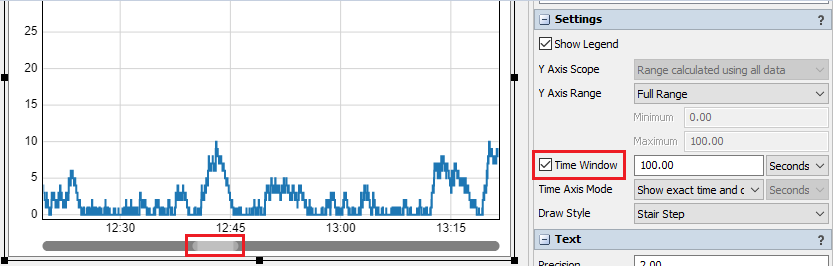
I am creating time plot on dashboard where x-axis contains time(date time format) and y-axis contains content value for 30 days. I am using y-axis split based on day. So there are 30 different horizontal sections in chart. At the end, values are not readable due to space constraint.

How can I apply filter on particular day to check the values in chart?

Thank you!


FlexSim 21.0.10
datasplitfiltertimeplot
5 |100000

Up to 12 attachments (including images) can be used with a maximum of 23.8 MiB each and 47.7 MiB total.

1 Answer

Felix Möhlmann avatar image
0 Likes"
Felix Möhlmann answered Ankur A3 commented

The 'Time Window' option allows you to scale the x-axis of a time plot, so the chart shows only a part of the data. You can set the window size in the properties or drag the edges of the scroll bar to change the size of the visible timeframe.

1656330321803.png


1656330321803.png (28.7 KiB)
· 5
5 |100000

Up to 12 attachments (including images) can be used with a maximum of 23.8 MiB each and 47.7 MiB total.