question

Nicolas Mbz avatar image
0 Likes"
Nicolas Mbz asked Nicolas Mbz commented

How to get percentage states by individual object in performance measure ?

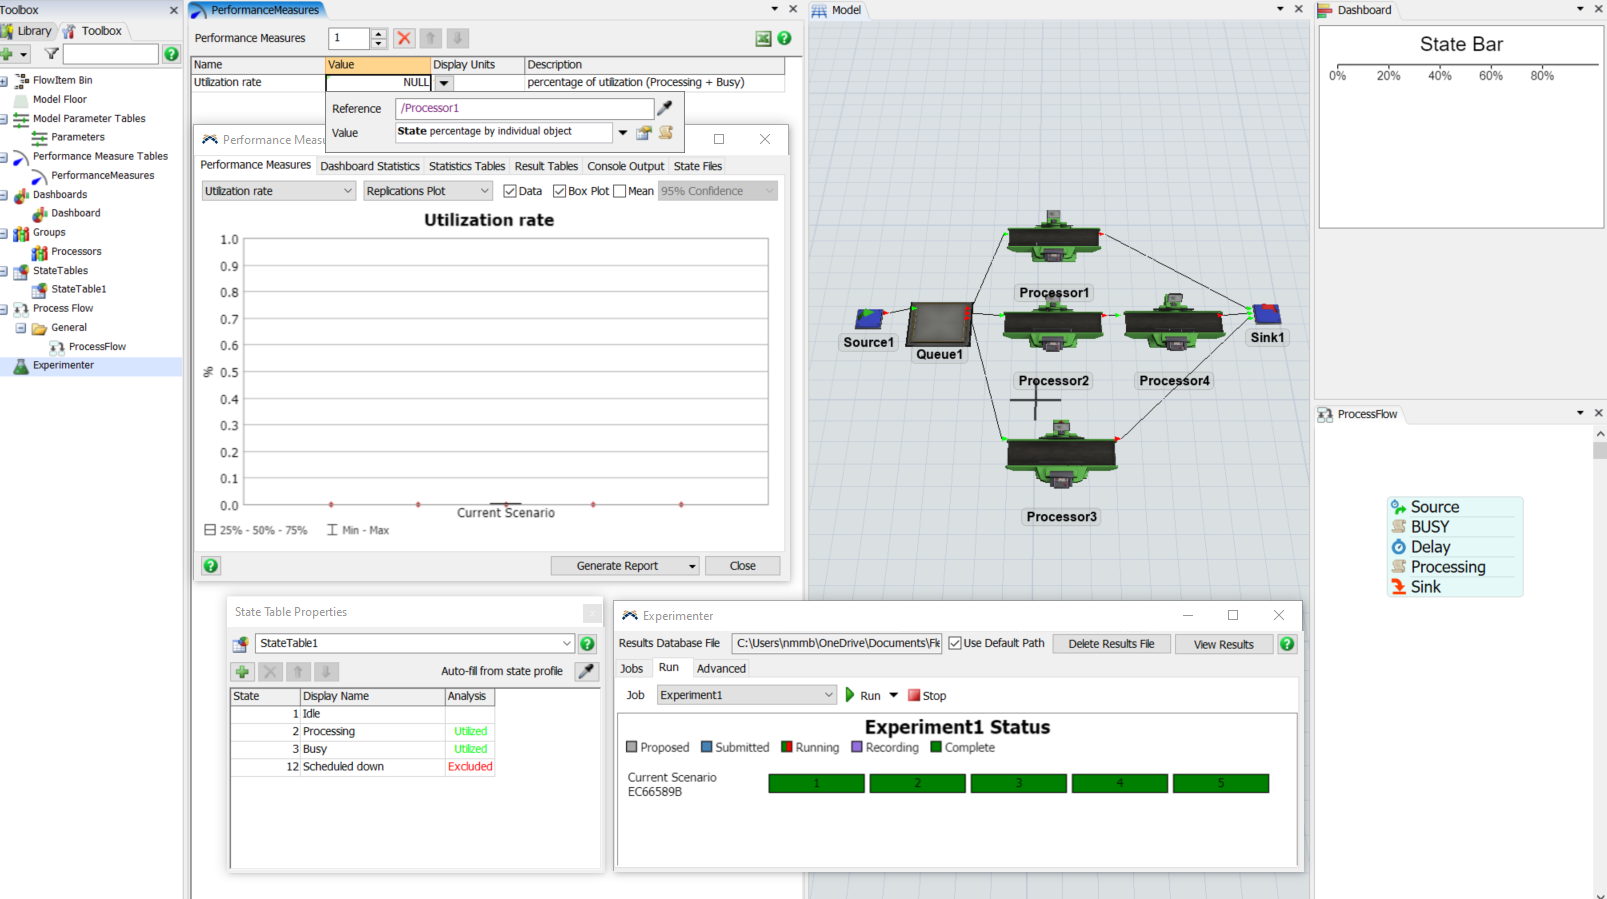
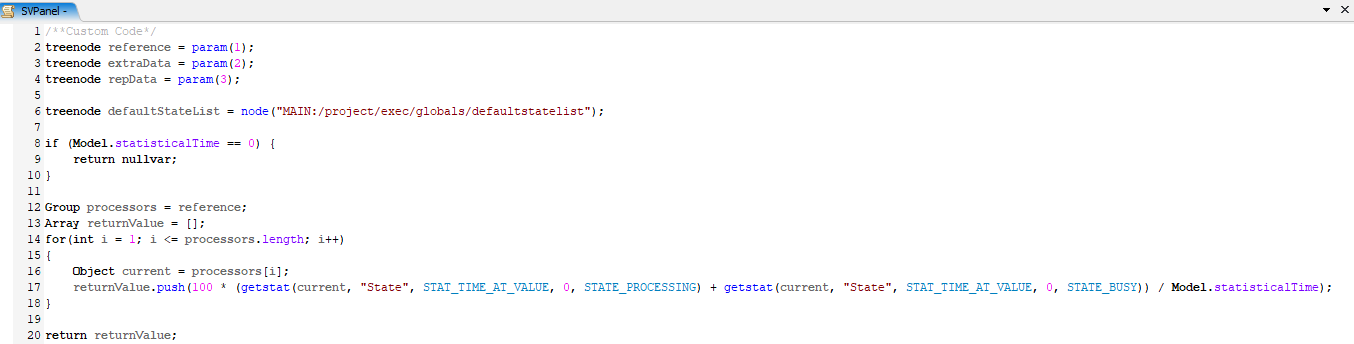
I want to get the average usage rates per objects contained in a group as a performance measure. I tried with only one object and with a group, but I'm not able to anderstand how to use the performance table to do that. The idea is to simply the results processing.

Option 1 (ideal) : Get the utilization rate (Busy+Processing)

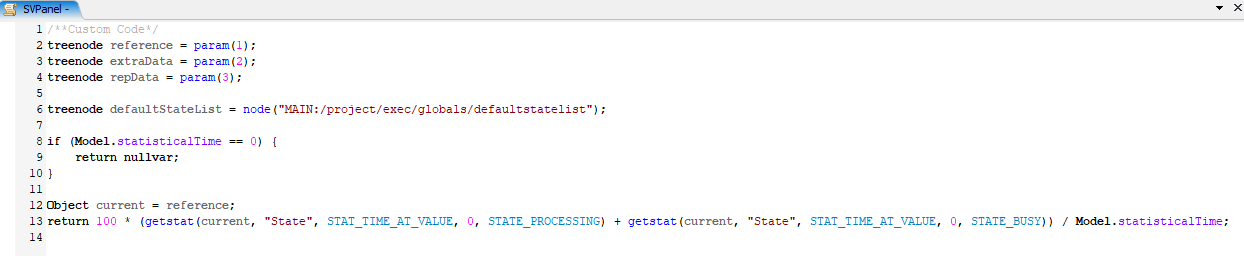
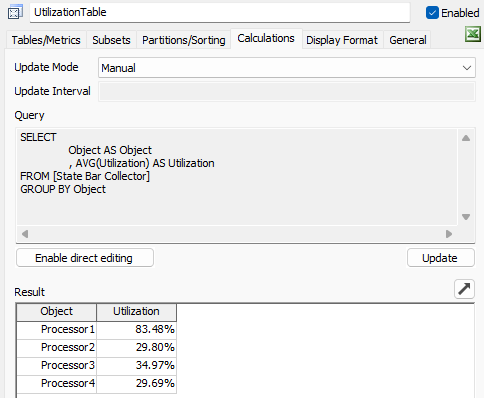
Option 2 (ok) : Get the percentage of time in a state (Busy)


1669113690564.png


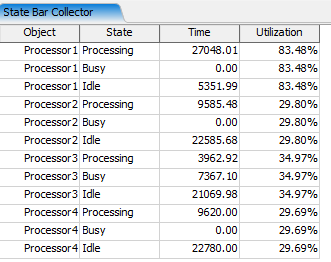
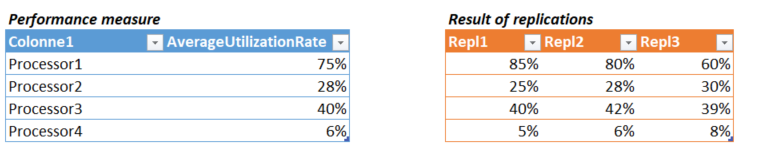
I imagine the result like this

1669114761298.png

Is it possible ? Thanks in advance

UtilizationRate_as_PerformanceMeasure_1.fsm

FlexSim 22.2.1
experimenterutilizationperformance measuresstate
5 |100000

Up to 12 attachments (including images) can be used with a maximum of 23.8 MiB each and 47.7 MiB total.

Jordan Johnson avatar image
0 Likes"
Jordan Johnson answered Nicolas Mbz commented

If you have a State Table, you can get the utilization of an object from a state table. In this case, you can make a Performance Measure, set an object as the reference, and then use code like this to get the utilization of that object for the Performance Measure:

/**Custom Code*/
treenode reference = param(1);
treenode extraData = param(2);
treenode repData = param(3);

if (Model.time <= 0) {
  return nullvar;
}

return getstatetableutilization(Table("StateTable1"), reference.as(Object).stats.state()) * 100;

The other part of your question, if I understand correctly, is that you want to see the utilization for each object in the group. But you have found that Performance Measures represent a single number.

So you have two options. The simplest option is to make one performance measure for every object in the group. This is a bit tedious, but it might work, if the number of objects in the group doesn't change. But that still won't present a table of values like the examples you shared.

The second option is more complex, but has a lot more possibilities. Here's an example model:

utilizationrate-as-performancemeasure-1_1.fsm

Here are the features demonstrated in this model:

  • There is a custom Statistics Collector that shows the utilization for each object in a group. It works by using an OnReset event, using every object in the group as a row value, and by using the getstatetableutilization() command.
  • There is a Table Chart that shows the data in the Statistics Collector. Run the model to see this chart update.

Run the Experimenter to see the rest of the features:

  • You can see each replication of the Table Chart in the Performance Measures window, on the Dashboard Statistics tab.
  • There is a Scenario Chart that shows the "average" table chart for the selected scenarios.
  • There is a Calculated Table that shows the data found in the results table. The Experimenter forces that table to update when a job finishes.
  • There is a Box Plot that shows the utilization data for each scenario, for each processor. The individual points are for each replication.

· 1
5 |100000

Up to 12 attachments (including images) can be used with a maximum of 23.8 MiB each and 47.7 MiB total.

Nicolas Mbz avatar image Nicolas Mbz commented ·
It seems to be perfect ! I'll try this :) Thanks a lot
0 Likes 0 ·
Felix Möhlmann avatar image
1 Like"
Felix Möhlmann answered Nicolas Mbz commented

When you open the code editor for the performance measure value, you can see how the command "getstat" is used to read the time spend in a single state, which is then divided by the model time and returned as the value.

You can simply copy the command and add the value for a different state to the returned value.

1669115153909.png

utilizationrate-as-performancemeasure-2.fsm

(In the attached model I use processor 3 because it has a non-zero "busy" percentage)

You can in theory put more than one value into a performance measure by adding them to an array. But then the experimenter is unable to generate graphs from that data. If you are only interested in the raw data and do your own plotting later on, then this might be useful if you have a lot of processors.

1669115725558.png1669115770020.png

The better solution might be to use statistics collectors instead of the performance measure to collect that data. The pre-defined state charts can show you the utilization directly. If you want to access the data behind them, you can "install" the components under the Advanced tab in the chart's properties and look at the statistic collector's table. (Individual times of the states and the overall utilization of the object).

1669115970739.png

This data could be refined down to just the object and the utilization with a calculated table.

1669116184722.png

1669116378960.png

utilizationrate-as-performancemeasure-3.fsm


· 1
5 |100000

Up to 12 attachments (including images) can be used with a maximum of 23.8 MiB each and 47.7 MiB total.

Nicolas Mbz avatar image Nicolas Mbz commented ·
Thanks a lot :)
0 Likes 0 ·

Write an Answer

Hint: Notify or tag a user in this post by typing @username.

Up to 12 attachments (including images) can be used with a maximum of 23.8 MiB each and 47.7 MiB total.