question

Karan avatar image
0 Likes"
Karan asked Karan commented

Composite WIP vs Time by hour

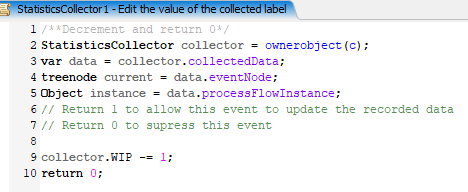
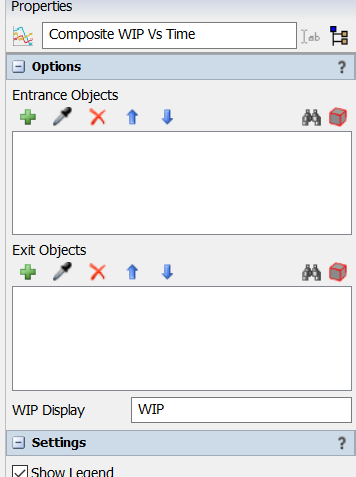
I created a custom statistics collector for a group of Queues where the contents/WIP is recorded at the end of every hour, however, I would like to use similar logic on a Composite WIP vs Time chart so that I can see the WIP between specified stations at the end of every hour through the simulation.

In the attached model there is a custom statistics collector that I created. I tried to look at the statistics collectors behind the composite chart but I don't think I understand how it works so not sure where to start.

ContentByHour.fsm

Could someone help me out or point me in the right direction?

FlexSim 22.2.2
dashboardsstatistics collectorqueue content
contentbyhour.fsm (71.4 KiB)
5 |100000

Up to 12 attachments (including images) can be used with a maximum of 23.8 MiB each and 47.7 MiB total.

1 Answer

Felix Möhlmann avatar image
0 Likes"
Felix Möhlmann answered Karan commented

The composite WIP chart uses two statistics collectors and two groups to gather the data. The two groups hold the Entrance and Exit objects respectively.

The Core Collector listens for entries into these objects, with different events for differenty types of objects (Fixed Resource, Process Flow activity, Task Executer, ...) because they require slightly different logic to handle the object types.

When an item enters an "Entrance Object" a new row is created with the item being used as the row value. This row only contains the time at which the event happened. When an item enters of the "Exit Objects" an a row already exists for that item, the row is "finished" (closed for further modification).

The second collector reacts to the events of the Core Collector. But first it creates a row for the row value "1" on reset and then again when the warmup time elapses. At the same time, a label "WIP" is created for the row and set to 0.

When the Core Collector creates a new row (item enters Entrance Object), a new row with the same row value is created and the label value is incremented by 1 and used to write the current content to the row. (The rows are all immediately finished, so using the same row value again will create a new row. The label is bound to the row value though, so it can be used to keep track of the content).

Then the Core Collector finishes a row, the same is done, but the row label is decremented.

The base chart uses this system to work with any object in FlexSim. For your purpose you can use a less flexible but simpler approach with only a single Statistics Collector.

It would have three events: An item entering an Entrance Object, an item entering an Exit Object (or exiting, depends on personal preference), and the hourly timer. Only the timer will actually create rows, the other events are only used to update a label on the collector that holds the current WIP value.

In order to not have the other events create rows, their "condition" field has to return false/0. But before we return that value, we can use the field to insert code that increments/decrements the label value, depending on which event is fired.

1674200820355.png

The hourly timer event then writes the current time and the current value of the label to a new row.

contentbyhour_fm.fsm


1674200820355.png (18.1 KiB)
· 3
5 |100000

Up to 12 attachments (including images) can be used with a maximum of 23.8 MiB each and 47.7 MiB total.