question

natsaran avatar image
0 Likes"
natsaran asked Jeanette F commented

How to create utilization chart for good parts?

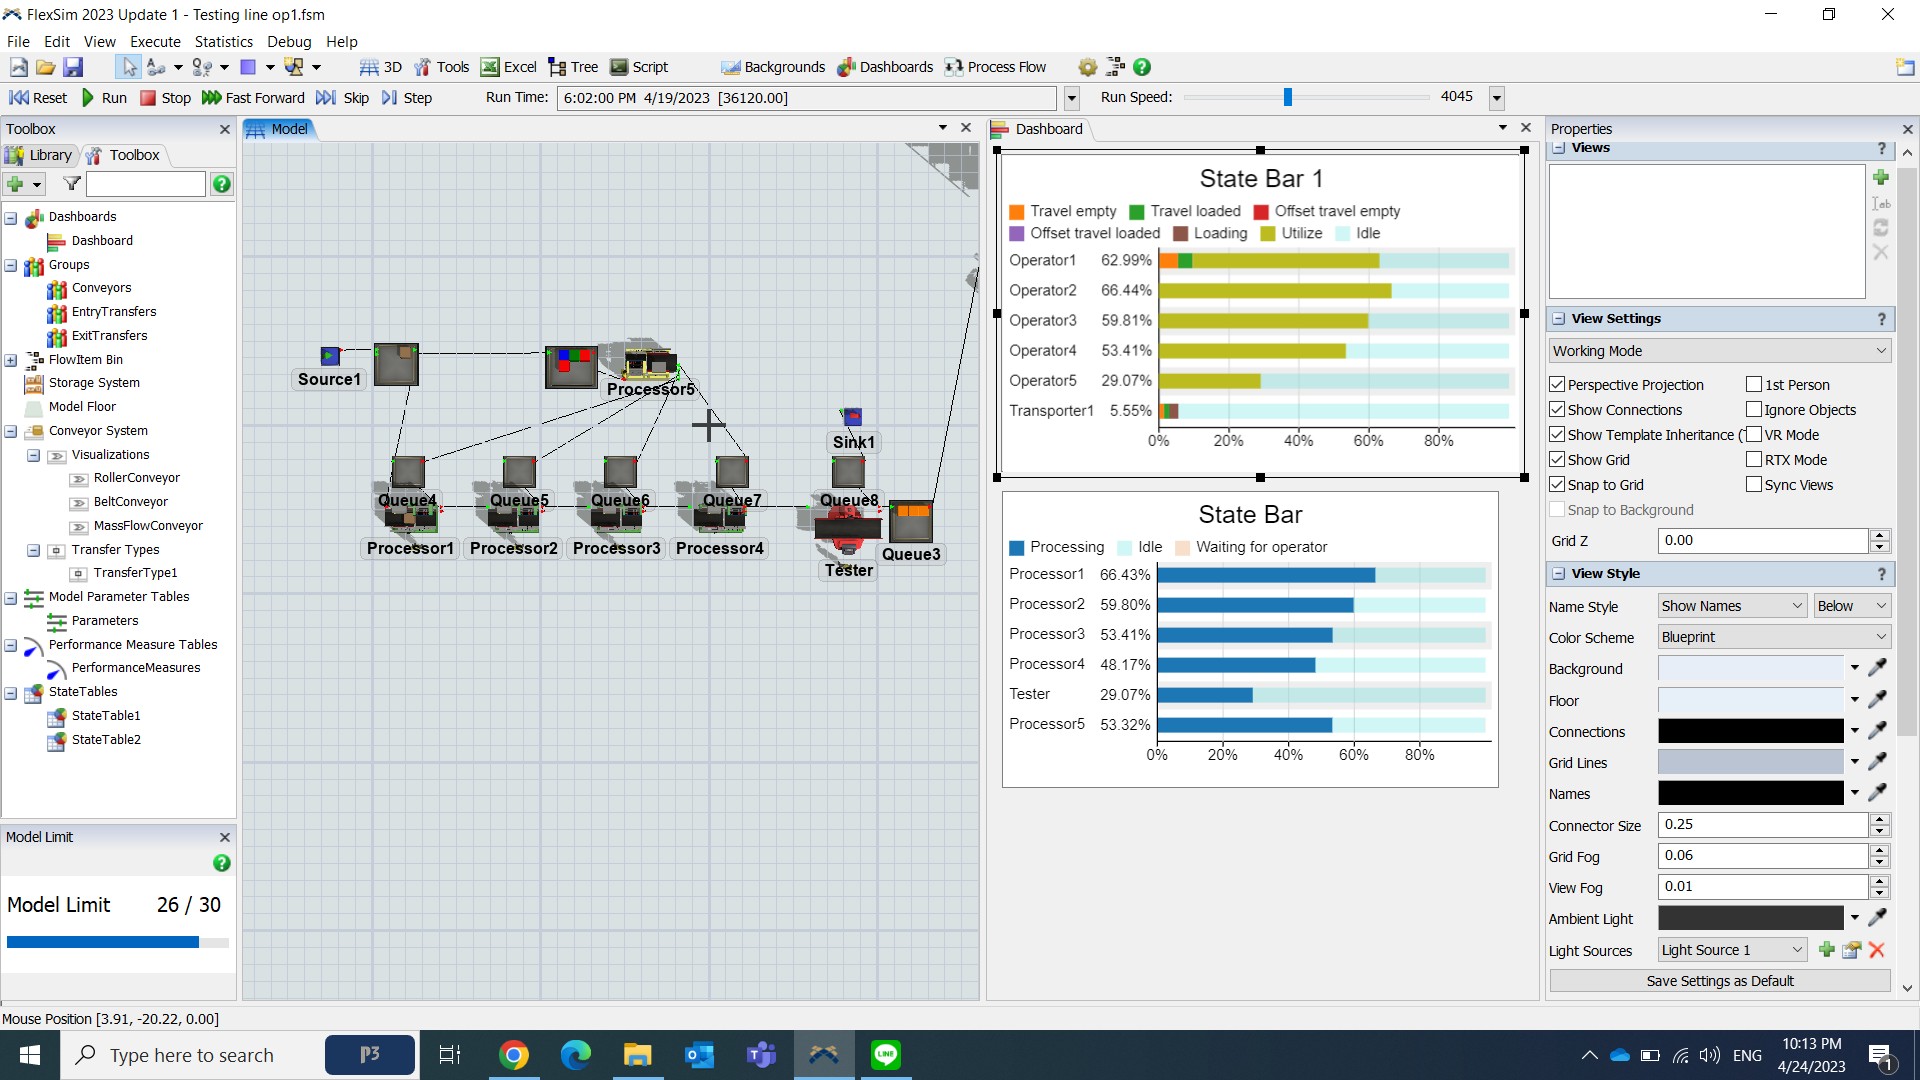
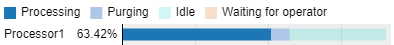
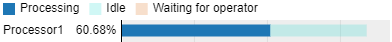
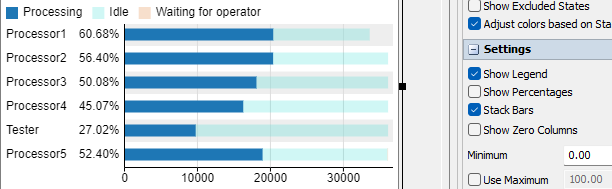
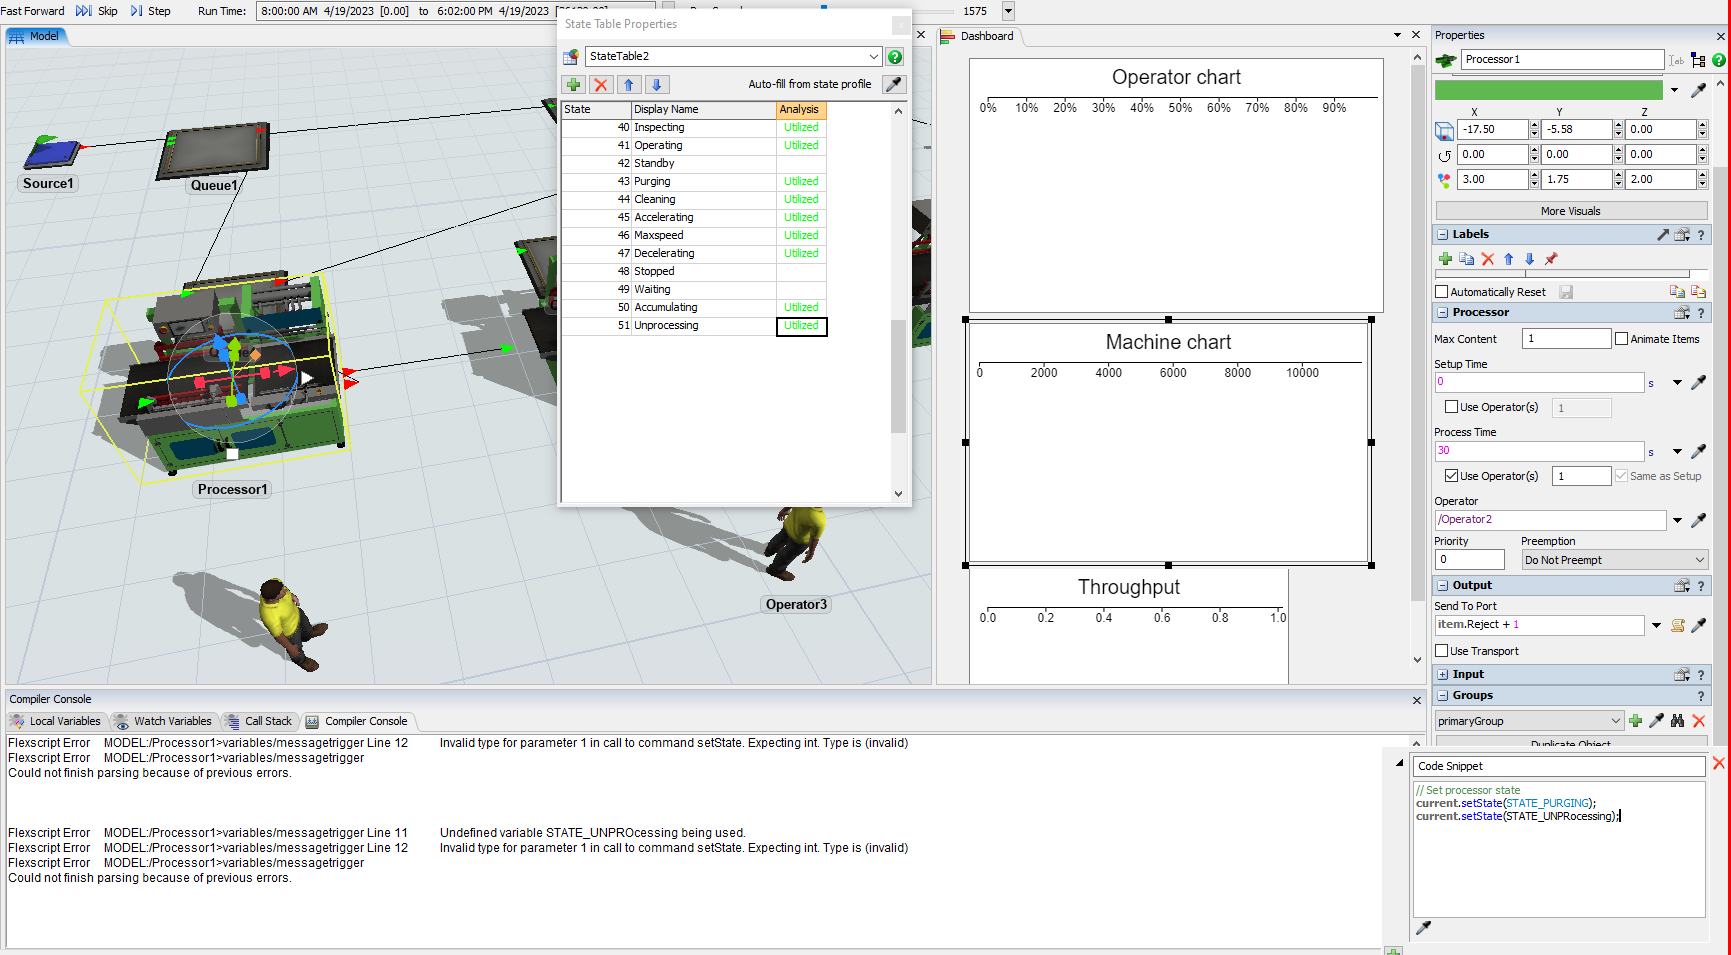
Hello, I need help with the simulation. I want to show the efficiency of each machine. In the model, each machine produces 90% good parts and 10% rejects. Reject parts would be sent to the queue in front of the machine. I have created a chart, but I think it shows the processing of the whole production, but I want it to show processing and other states of producing good parts only.

1. Could you please tell me how to do this?

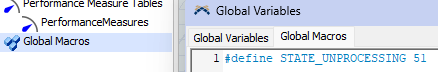
2. How to change X label of utilization chart from percent to time? I would like to know how many time of each state use per day. I would like to create Yamazumi chart.

Thank you in advance

Testing line op1.zip


1682352220332.jpg

FlexSim 23.1.1
state chartdashboard chartsimulation questions
1682352220332.jpg (420.6 KiB)
· 1
5 |100000

Up to 12 attachments (including images) can be used with a maximum of 23.8 MiB each and 47.7 MiB total.

Jeanette F avatar image Jeanette F ♦♦ commented ·

Hi @natsaran, was Felix Möhlmann's answer helpful? If so, please click the "Accept" button at the bottom of their answer. Or if you still have questions, add a comment and we'll continue the conversation.

If we haven't heard back from you within 3 business days we'll auto-accept an answer, but you can always unaccept and comment back to reopen your question.

0 Likes 0 ·

1 Answer

·
Felix Möhlmann avatar image
2 Likes"
Felix Möhlmann answered

I'd decide whether an item is a reject when it enters a processor. That way you can change the processor state to some otherwise unused state and set it to be excluded from the utilization calculation in the state table.

In the attached model I set up the first processor in the line for this. (I use the purging state to represent time spent working on reject parts)

Below are two chart examples: The first with the purging state included, the second without it.

1682403160520.png

1682403193779.png

To change the x-axis to time values just uncheck the "Show Percentages" option in the chart properties.

1682403270572.png

Testing line op1_1.fsm


5 |100000

Up to 12 attachments (including images) can be used with a maximum of 23.8 MiB each and 47.7 MiB total.

Write an Answer

Hint: Notify or tag a user in this post by typing @username.

Up to 12 attachments (including images) can be used with a maximum of 23.8 MiB each and 47.7 MiB total.