Hello,
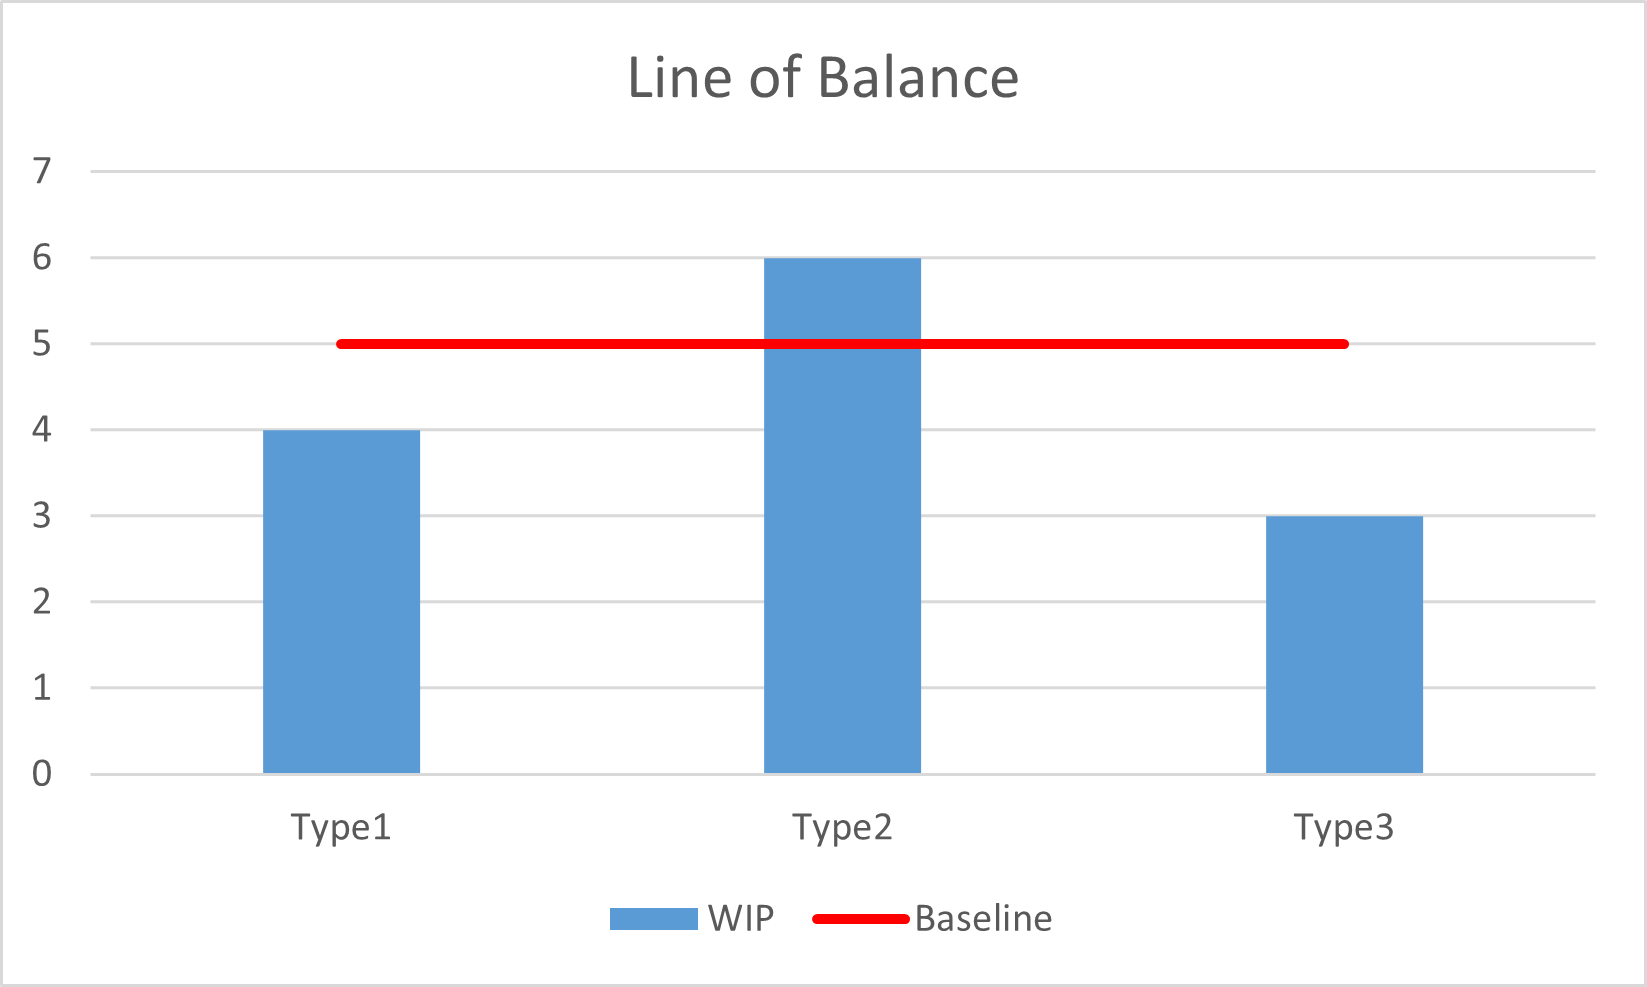
I'm trying to create a baseline in Time Plot like below figure:
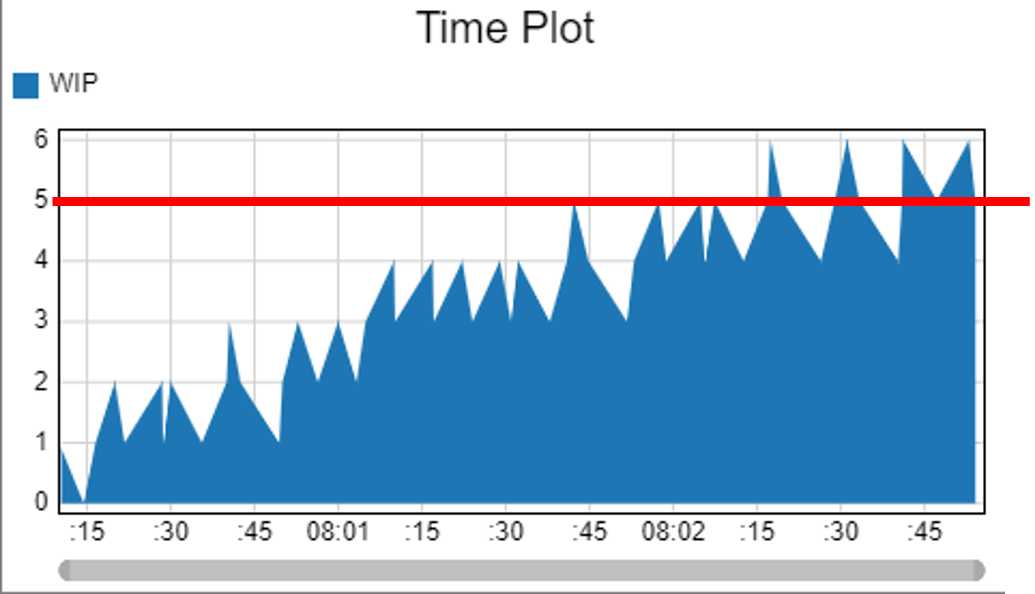
What should I do?
Thanks in advance!
Hello,
I'm trying to create a baseline in Time Plot like below figure:
What should I do?
Thanks in advance!
Here's a couple of solutions using an additional category column by which we can do color based split.
In this version we just duplicate the event and give the new event a fixed value:
while in this version the row add trigger adds an extra entry directly to the bundle data:
13 People are following this question.
FlexSim can help you understand and improve any system or process. Transform your existing data into accurate predictions.
FlexSim is a fully 3D simulation software environment. FlexSim can be used to simulate any process in any industry.
FlexSim®, FlexSim Healthcare™, Problem Solved.®, the FlexSim logo, the FlexSim X-mark, and the FlexSim Healthcare logo with stylized Caduceus mark are trademarks of FlexSim Software Products, Inc. All rights reserved.
May we collect and use your data?
Learn more about the Third Party Services we use and our Privacy Statement.May we collect and use your data to tailor your experience?
Explore the benefits of a customized experience by managing your privacy settings for this site or visit our Privacy Statement to learn more about your options.