question

Maryam H2 avatar image
0 Likes"
Maryam H2 asked Maryam H2 commented

General environment chart setup: Census vs. Time & Staff utilization etc.

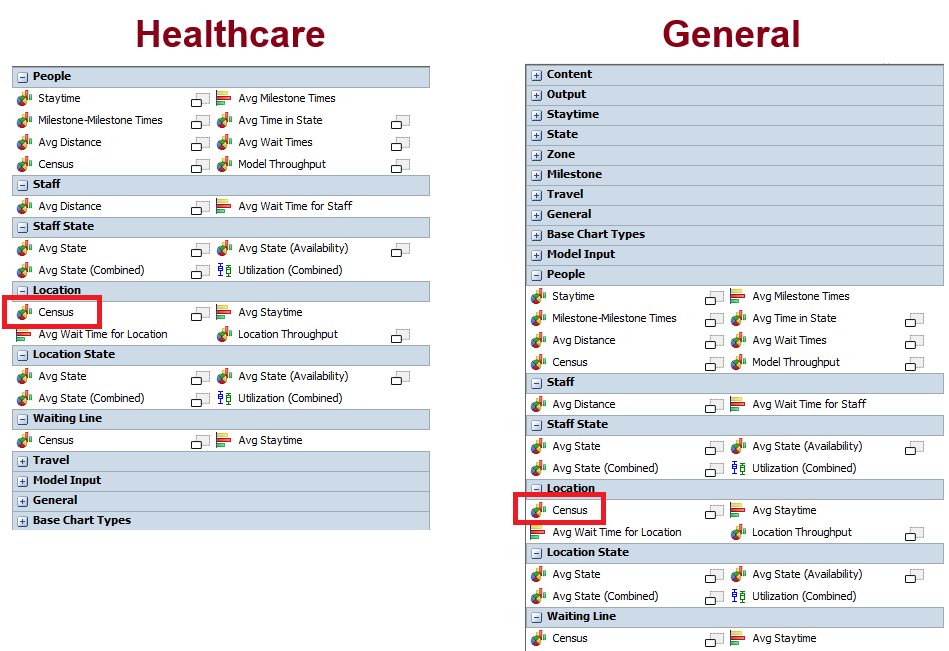
In the HC environment, there's a chart called "Staff or Location Utilization." How can I create similar charts in the General environment when my staff groups are categorized under Groups rather than Staff specifically, and I don't see an option to select Staff?

Lastly, another chart that's missing for me in the General environment is the "Location Census." In the HC environment, we could group locations and see the census (or see for a single location), but how can I create this in the General environment?

FlexSim 23.2.0
utilizationstaffwait for operator
· 4
5 |100000

Up to 12 attachments (including images) can be used with a maximum of 23.8 MiB each and 47.7 MiB total.

Matthew Gillespie avatar image Matthew Gillespie ♦♦ commented ·

@Maryam H2

All of the HC charts are available in the General environment as well. They're merely moved to the bottom of the list.

1696888100065.png

0 Likes 0 ·
1696888100065.png (87.7 KiB)
Maryam H2 avatar image Maryam H2 Matthew Gillespie ♦♦ commented ·

@Matthew Gillespie

I see, but it appears that the charts for "Census vs. Time for Locations" and "Combined Utilization for Staff" aren't functioning as expected. In the attached model, I've attempted to create a "Census vs. Time" chart using two floor spots, and I'm also interested in visualizing utilization for two distinct staff groups. But none of these charts are displaying as they should.

Could you tell what might be causing this issue?

1696950038999.png

I'm attaching a simple model here.

simple_model_ge_charts.fsm

0 Likes 0 ·
Matthew Gillespie avatar image Matthew Gillespie ♦♦ Maryam H2 commented ·
For this model you should just use some of the standard charts and not try to use the healthcare charts because you're not doing anything that interacts with the healthcare stats and you're not using healthcare objects (except the two floor spots).


Some of the reasons those charts aren't working in this model:
  • Nothing enters or exits the floor spot objects
  • Group1 and Group2 aren't members of the Staff group
  • The operators aren't Staff objects and so don't have the HC States state profile
  • Nothing is setting the HC States of the operators
0 Likes 0 ·
Show more comments

1 Answer

·
Matthew Gillespie avatar image
0 Likes"
Matthew Gillespie answered Maryam H2 commented

Here is your model where I added all the different State charts and added Group1 and Group2 to them. I also added a Content line chart and added the queues and racks to it.

simple-model-ge-charts_1.fsm


· 3
5 |100000

Up to 12 attachments (including images) can be used with a maximum of 23.8 MiB each and 47.7 MiB total.

Maryam H2 avatar image Maryam H2 commented ·
@Matthew Gillespie Got it, but not all the staff states show their real states, for example if they are handling something on them it shows them as an idle or while they're working? is this automatic or shomething that I need to define myself for each oeprator?
0 Likes 0 ·
Matthew Gillespie avatar image Matthew Gillespie ♦♦ Maryam H2 commented ·

You have to either give them tasks that set their state and have them spend time doing that task, or set the operator's state yourself.

simple-model-ge-charts_3.fsm

For example, in the attached model I set the Load Time and Unload Time fields on all the operators to a couple minutes so that they spend some time in the Load and Unload states. I hooked Operator3 up to a queue and processor so that they give him tasks. You can see he goes into different states as he does the tasks given him by those objects.

Then in your Source process flow I set the operator's state to Processing before they spend 10 minutes in a Delay activity.

0 Likes 0 ·
Maryam H2 avatar image Maryam H2 Matthew Gillespie ♦♦ commented ·

Got it, thanks for the clarification!

0 Likes 0 ·

Write an Answer

Hint: Notify or tag a user in this post by typing @username.

Up to 12 attachments (including images) can be used with a maximum of 23.8 MiB each and 47.7 MiB total.