Hi there,
I am using FlexSim 2016 Update 1.
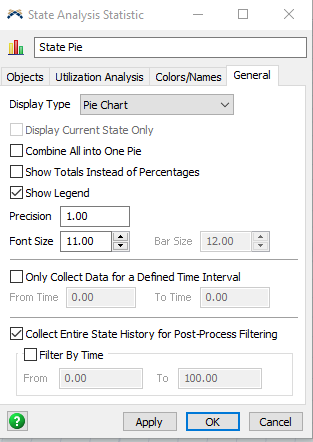
I want to capture the utilization of processors per hour interval of a day and then export this data to SQL for further analysis through the use of a BI tool (Qlikview). I know you can use the State Pie and then "filter" to the hour you want (see below) but i cant get to this data through an experiment.
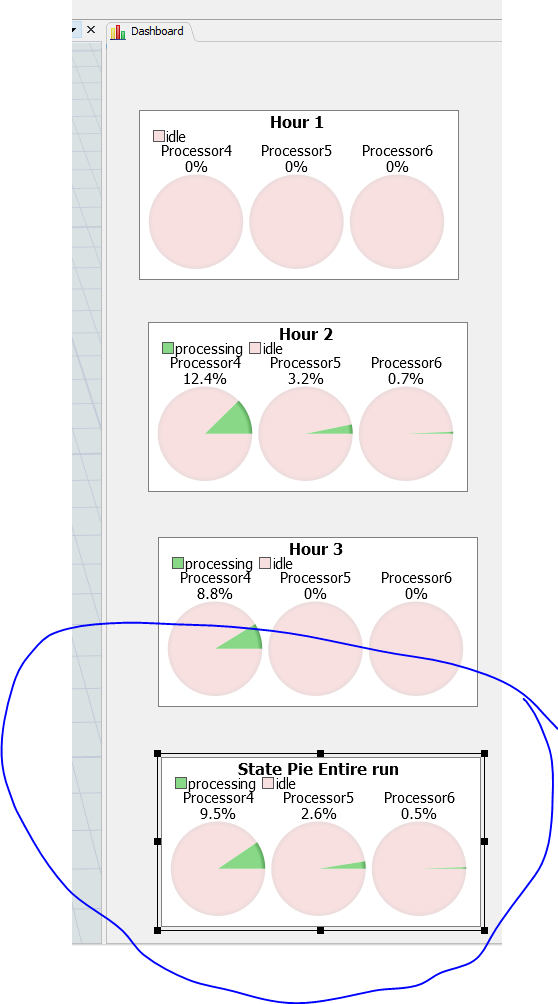
Thus i placed a state pie for each hour i want to measure, so i have a state pie measuring hour 1, another hour 2, another hour 3 and so forth. I then ensure that i save the dashboard after each experimenter replication. This allows me access to the data after an experiment run and my plan is to export this data after all the replications.
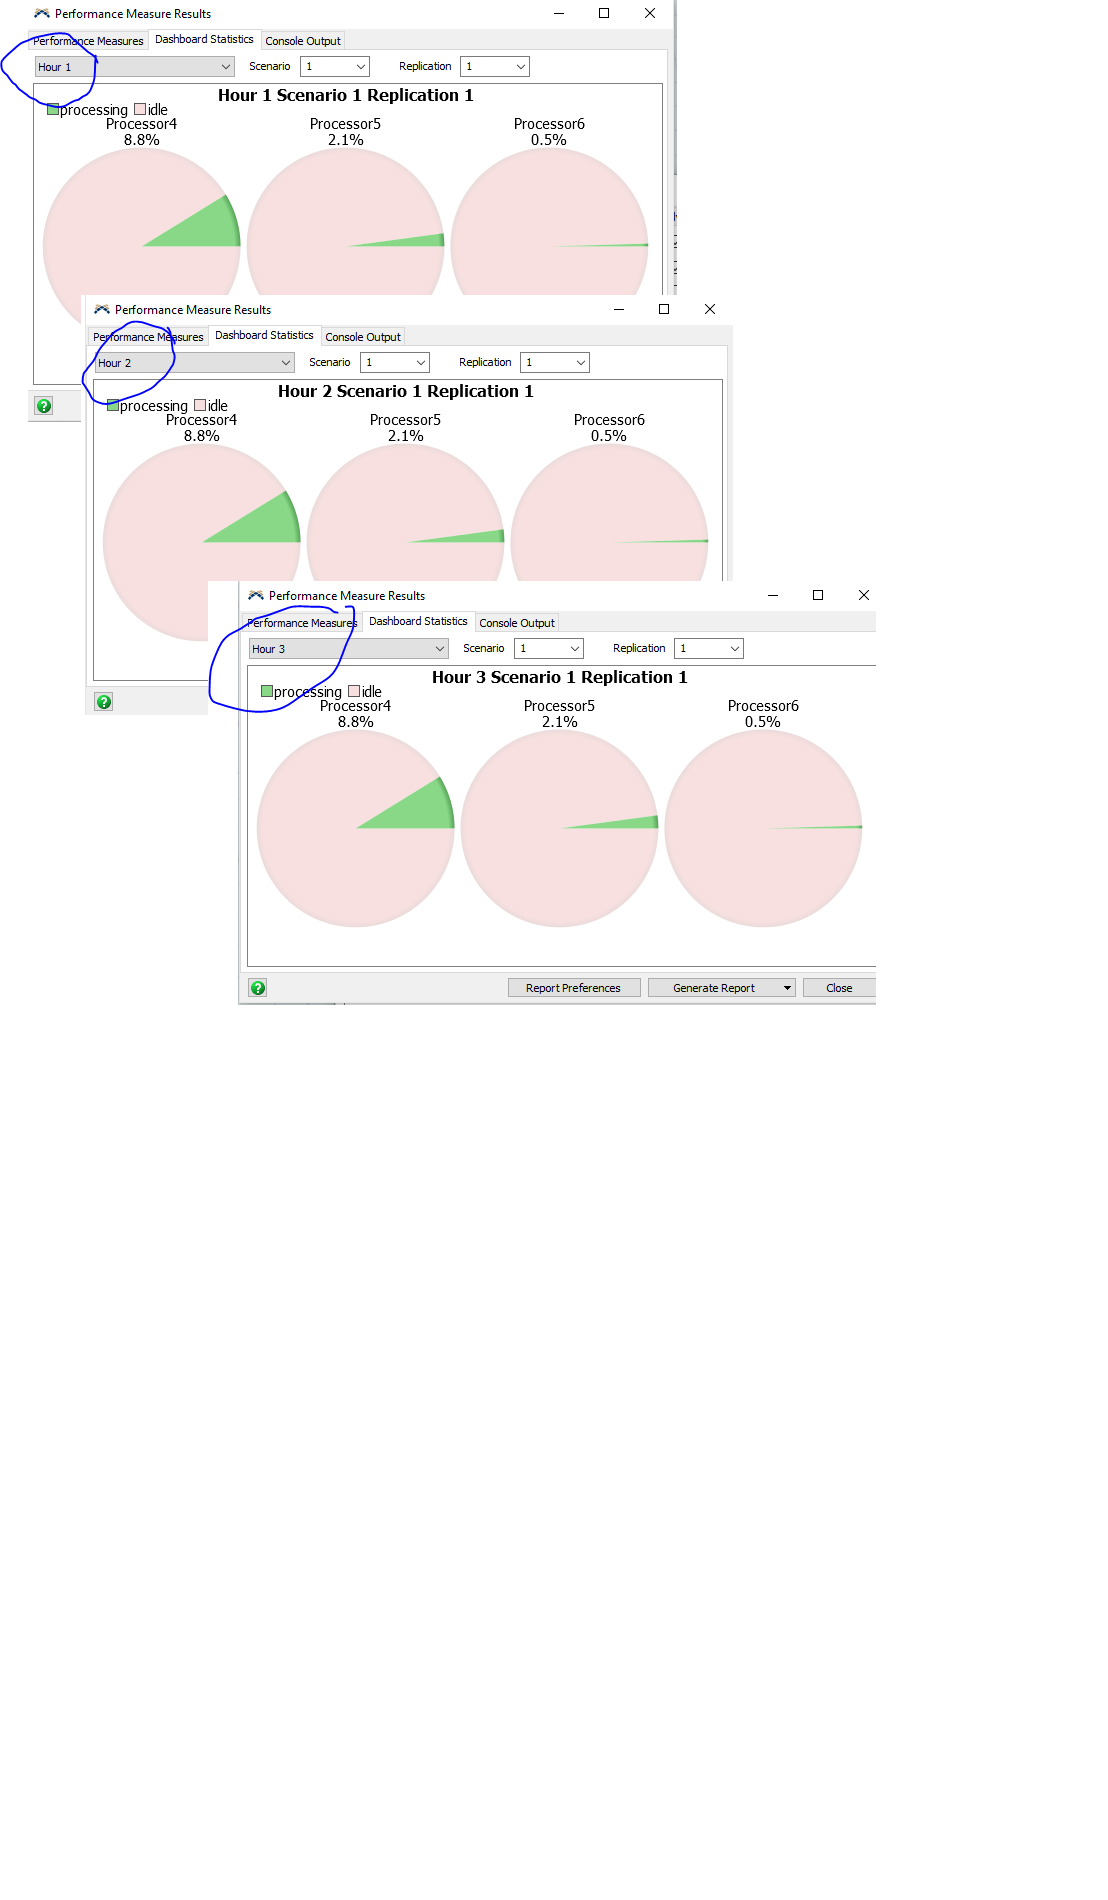
However, while doing this exercise i noticed that the state pie(s) do not measure correctly during an experiment run. They seem to only save the entire model runs state and then displays this for all the pie's on the dash board. So i have attached two images to try and show this. The first is the state pies in the experimenter view, you will see they are all the same for each hour. However the second image is when i run the same model and record the data in a dashboard (this is what should be happening in the experimenter).state-pies-per-hour-during-model-run.png state-pies-per-hour-during-experimenter.png
Thinking i was going mad i then re-did the entire exercise in v7.7.4. This time is worked perfectly.
Is there a known bug that is doing this in the latest version? And could you assist me to fix it as i need this function for a project i am currently busy with.
I have attached both the versions i have built so that you can look at my logic.
Any assistance would be greatly appreciated.
Have a good day.
Regards Jason
NOTE: i am using an experimenter to change the number of customers arriving each day per hour throughout a month. The experimenter allows me to run each day multiple times. I use a global table connected to a source to achieve this.
