question

Raashid Mohammed avatar image
0 Likes"
Raashid Mohammed asked anthony.johnson edited

How do I chart request queue stats on a zone partition calculation

See attached model

I have token labels type and count

they enter zone with partition by label type and only allow 1 token per type

each token entering the zone has a count value

I want to chart to show how many tokens are requesting for input and I want the chart the count value in the token

for example

if I have 2 tokens with count value

type - 1 with count - 100

type - 2 with count - 200

I want chart to show that there is 100 type 1 requesting for input to enter zone and 200 type 2 requesting to enter zone

please help zonecal.fsm

Choose One
zone subset
zonecal.fsm (18.1 KiB)
5 |100000

Up to 12 attachments (including images) can be used with a maximum of 23.8 MiB each and 47.7 MiB total.

1 Answer

·
anthony.johnson avatar image
1 Like"
anthony.johnson answered anthony.johnson edited

I have an answer for you, but unfortunately the answer only works in our upcoming 16.2 release. When I do this in 16.1, I get errors. Jordan, our zone and stats guy, appears to have fixed issues here, but they are yet to be release. So I suggest trying this on the latest 16.2 beta. If it's for a production project, maybe wait for a few weeks (we should have the final 16.2 release out in September).

I've attached a model that has both a chart that tracks the partition request queue by number of tokens, and the partition request queue by total count.

To get these charts, I did the following:

    1. Click on the zone, and in quick properties beside its name, click the button.
    2. Choose one of the stats (doesn't matter which because we're not going to use that stat) and click the button beside it, then choose Pin to Dashboard.
    3. Double click on the created chart.
    4. In its properties, go to the Statistics tab, and delete the stat you chose, then add a new stat by clicking the button. To get the number of tokens requesting, choose Zone Partition Statistics
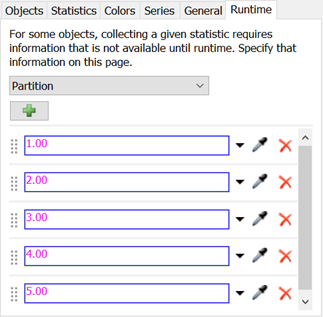
 | PartitionRequestContent.To get the total count calculation, choose Zone Partition Calculation Statistics | PartitionRequestCalculationTotal.
    5. Reset and run the model. Then go back to the Runtime tab of the chart properties. Add 5 runtime values: 1, 2, 3, 4, and 5.
    6. You can now go to the Series tab and name each series as needed.

    Admittedly, the UI is a bit hard to navigate at this point. We are working on a new statistics mechanism that will hopefully be easier to figure out. 2128-zonecalwithpartitionstats.fsm


    runtime.png (39.1 KiB)
    statsbutton.png (1.2 KiB)
    pin.png (984 B)
    add.png (1.1 KiB)
    · 1
    5 |100000

    Up to 12 attachments (including images) can be used with a maximum of 23.8 MiB each and 47.7 MiB total.

    Raashid Mohammed avatar image Raashid Mohammed commented ·

    When do the steps above it gives me error

    time: 1.590911 exception: int runthemessageloop() #6 time: 1.590911 exception: Exception caught in start() of activity "Enter Zone" in "ProcessFlow". Continuing throw... time: 1.590911 exception: Exception caught in start() of activity "Source" in "ProcessFlow". Continuing throw... time: 1.590911 exception: Exception caught in Executive::processeventinlist(). Throwing. time: 1.590911 exception: Exception caught in Executive::steptotime(). Throwing. time: 1.590911 exception: Exception caught in Executive::tick(). Throwing. time: 1.590911 exception: int runthemessageloop() #4 exception: core->theexecutive.tick(); time: 1.590911 exception: int runthemessageloop() #6

    If there is no other way I will wait for the new release

    thanks

    Raashid

    0 Likes 0 ·

    Write an Answer

    Hint: Notify or tag a user in this post by typing @username.

    Up to 12 attachments (including images) can be used with a maximum of 23.8 MiB each and 47.7 MiB total.