Hi,
I’m having issues with the attached model. The model was originally created three years ago, then updated this past year in version 7.3. We then tried to use the model in the newest version, but are experiencing issues with the model.
Here are a few things that are not working properly:
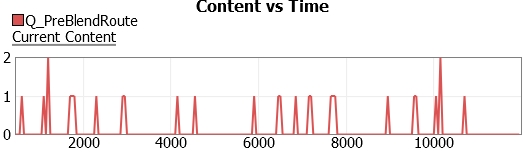
- Items are getting stuck in the queue “Q_PreBlendRoute”. Each of the following seems to resolve the issue and may help to debug, but it is not the solution:
- Uncheck “Use transport” for “Q_PreBlendRoute” -OR-
- Uncheck “Enable” in the 2ShiftSchedule timetable -OR-
- Uncheck “Enable” in the LunchAndBreaks timetable.
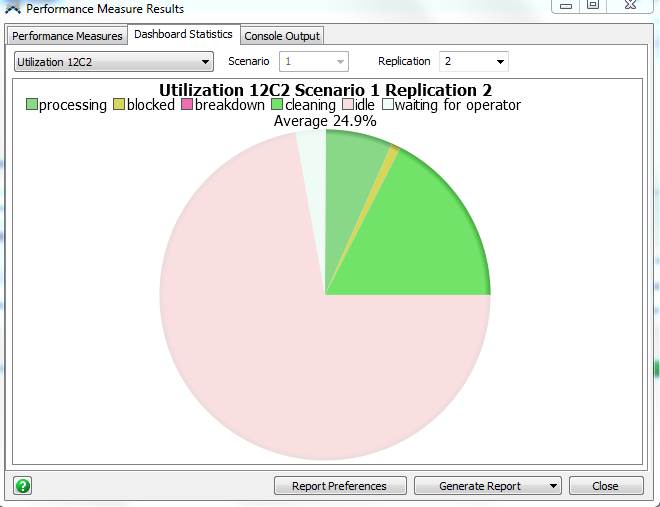
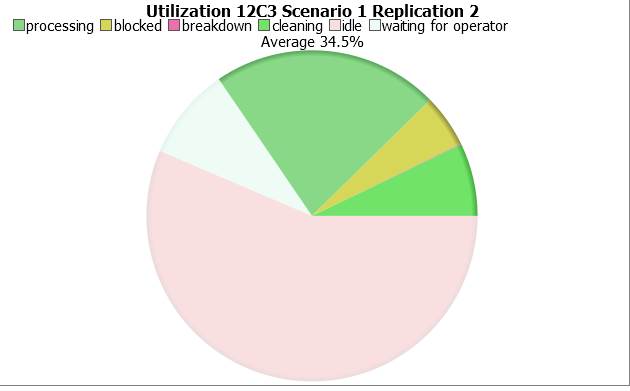
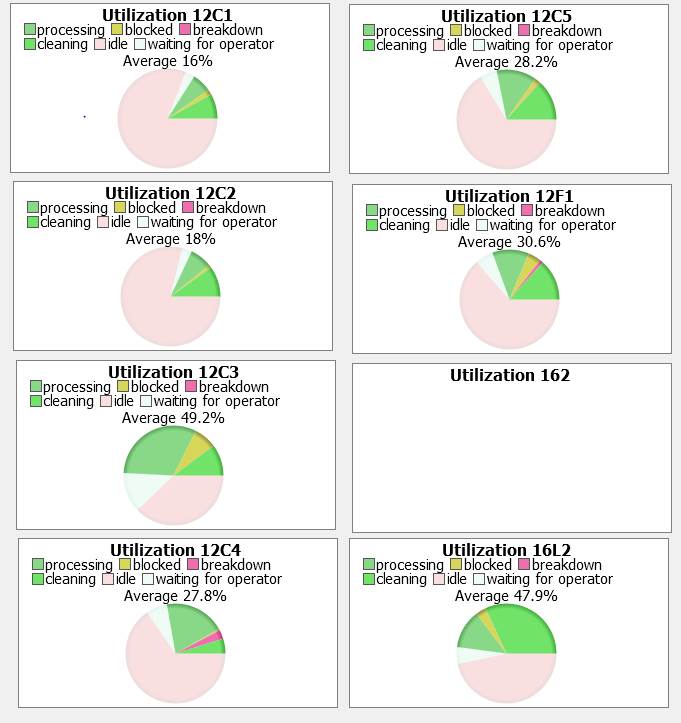
- I’m not sure the experimenter is recording results correctly. Pictured below, rep 2 shows line 12C2 as 24.9% utilized and 12C3 as only 34.5 % utilized. I opened up the rep 2 state file and looked at the same dashboard pie charts the experimenter is pulling from. The utilizations are 18% and 49.2% respectively.
We can discuss over the phone or with screen sharing for additional questions or background if that is easier. Please let me know what is causing these issues and how to resolve. Your help is greatly appreciated.
Pie charts in replication dashboard:
Thanks,
Brad
Brad Prizer| P.E., PMP | Industrial Engineer
---------------------------------------------------------------------------------------------------------------
CRB | Engineering| Architecture| Construction|Consulting
---------------------------------------------------------------------------------------------------------------
220 West Germantown Pike, Suite 170, Plymouth Meeting, PA 19462
d:610-823-2180 |o:610-278-7644 |f:610-278-9194
www.crbusa.com|LinkedIn | Facebook | Twitter
THE RELENTLESS PURSUIT OF SUCCESS. YOURS.TM
