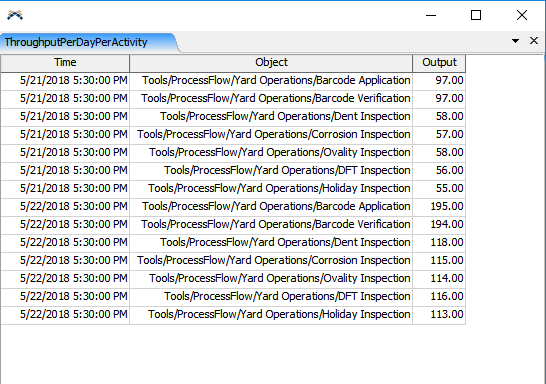
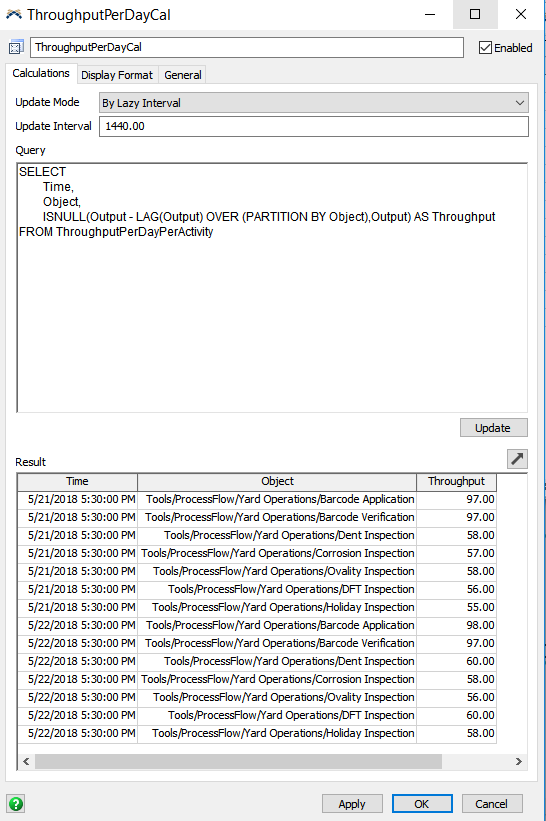
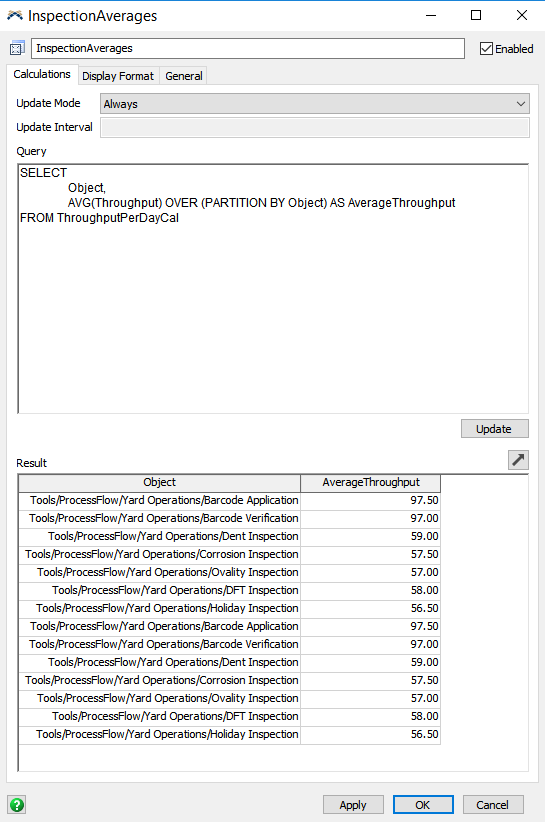
I'm trying to obtain a dashboard table that shows the calculated average throughput per working day (off Sundays) for each activity in the process flow that is updated as the model runs and later when I run the experiments be able to get the data for each run. I created a statistics collector (statisticcollector.png) with a timer that collects the current output for each activity every working day. Then I created a calculated table (calculatedtablenetthroughput.png) to calculate the net throughput for each day. Lastly I created another calculated table (calculatedtableaveragethroughput.png) to calculate the average throughput for each activity but every time there's an update instead of replacing the same rows, it creates a whole new set of rows. How can I prevent the table from doing this? Is there a better way of achieving this? and after the table works, can I see these values as performance measures in experimenter or at least save the data of each run for this table and export it to Excel?
How can I obtain a table for average throughput per custom time intervals?
FlexSim 18.0.3
It sounds like you want the second Calculated Table to average the daily throughput for each object. If that is the case, you should use a GROUP BY statement, rather than using PARTITION BY with LEAD or LAG.
- SELECT Object, AVG(Throughput) AS AvgThroughput FROM ThroughputPerDayCal GROUP BY Object
You didn't send information about how your statistics collector has been set up, so I can't tell you why you are getting a new row in your table for each entry as apposed to overwriting the same cell in the table.
A good way to learn how to properly set up a statistics collector and/or calculated table is to start with one that has already been defined for a dashboard template that captures something close to what you are looking for. For instance, in your case, you could drag out a Throughput Per Hour (Text) dashboard template, change the Interval from 1-hour to 1-day, and then click the "Install" button on the dashboard settings' Advanced tab. Doing so will create a Statistics Collector named "Throughput Per Hour Collector" and a Group named "Throughput Per Hour Objects" and a Calculated Table named "Throughput Per Hour CalculatedTable". Then you can go take a look at each of these to see what was involved in making the chart. If you do this, you will notice that the table for both the Statistics Collector and Calculated Table create just a single cell in their table for each object for which you are recording the throughput for.
As for using data from your tables as a PFM in an experimenter, you will do this the same way you would for any other table. For instance, if you want to use the value in row 5, column 3 of the table for "StatisticsCollector1", you would use the following expression for your PFM:
- return Table("StatisticsCollector1")[5][3];
If you would like to dump the entire table after an experimenter, then read this post:
https://answers.flexsim.com/questions/47255/export-table-from-statistics-collector-after-each.html
10 People are following this question.
