question

yoni A avatar image
0 Likes"
yoni A asked yoni A commented

qty produced per day

is it possible to set up a table that shows the qty produced per day for different item types, so I can compared day by day. A new column(day) is generated at the end of a day

FlexSim 18.2.0
throughput
· 2
5 |100000

Up to 12 attachments (including images) can be used with a maximum of 23.8 MiB each and 47.7 MiB total.

Jeff Nordgren avatar image Jeff Nordgren commented ·
@yoni A

Can you send your model or a sample model that shows the problem?

Thanks.

1 Like 1 ·
yoni A avatar image yoni A Jeff Nordgren commented ·

see table below @Jeff Nordgren

0 Likes 0 ·

1 Answer

·
Emily Hardy avatar image
0 Likes"
Emily Hardy answered yoni A commented

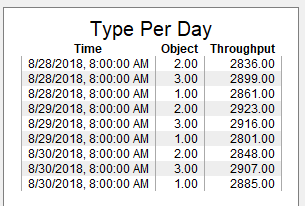
If you want a simple way to do this, you could add a "throughput per hour by type" line graph, install the template, and then create a table chart using the "Throughput Per Hour by Type 1 Collector". This will give you the day, the type (listed as "object") and throughput as shown:

You could also use the stats collector to create a more custom chart or table but this is a nice, easy way of doing it.

type-per-day.fsm


· 1
5 |100000

Up to 12 attachments (including images) can be used with a maximum of 23.8 MiB each and 47.7 MiB total.

yoni A avatar image yoni A commented ·

table-example.xlsx

see table attached @Emily Hardy

I want to see how the values changes from one day to another

0 Likes 0 ·
table-example.xlsx (18.6 KiB)

Write an Answer

Hint: Notify or tag a user in this post by typing @username.

Up to 12 attachments (including images) can be used with a maximum of 23.8 MiB each and 47.7 MiB total.