how to use the throughput per hour table statistics on a station placed on a conveyor? the statistics works fine on a processor
Hello Yoni,
It is same as you have done for Processer. Drag Output/hour chart in the dashboard and add station in the objects tab.
The Throughput Per Hour template currently does not support conveyor stations as objects. The easiest way to get that template to display the data you want is as follows.
I made this demo model that shows how to get the chart you want:
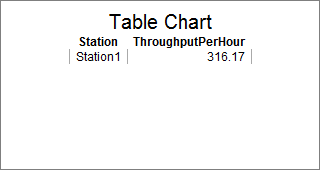
To get this chart, you need to make a Statistics Collector. The collector does not listen to any events. On the Data Recording tab, set the row mode to Enumerate. Sample the stations you want to show on the chart.
Then you need to add three columns. For the first column, set the Update Mode to When Row is Added. For the value, use the picklist to choose IDs, then choose ID of Row Value.
For the second column, set the Update Mode to Always. For the value, use the picklist to choose Statistics, then choose Statistics By Object. In the popup, set the object to data.rowValue, and choose the current Output.
For the third column, set the Update Mode to Always. For the value, use the following code:
- /**Custom Code*/
- StatisticsCollector collector = ownerobject(c);
- var data = collector.collectedData;
- treenode current = data.eventNode;
- Object instance = data.processFlowInstance;
- // determine the number of hours
- double duration = Model.statisticalTime / 3600;
- // If no time has elapsed, return zero to avoid divide by zero
- if (duration == 0)
- return 0;
- // Look up the throughput value in the current table
- double throughput = Table(collector)[data.rowNum][2];
- return throughput / duration;
This code just gets the value from the second column, and divides it by the total number of hours.
8 People are following this question.
