How do you create a table with columns and rows that records specific information of your simulation as it runs several days, like units requested, shipped and produced, and inventory levels as it fluctuates from day to day
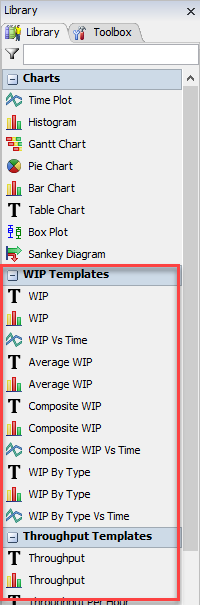
You can create a Chart Template:
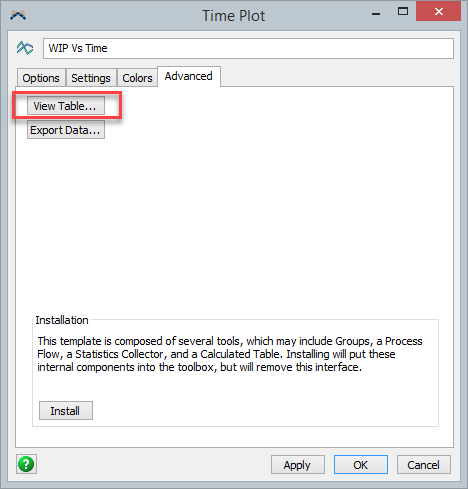
Then you can view the table for that template:
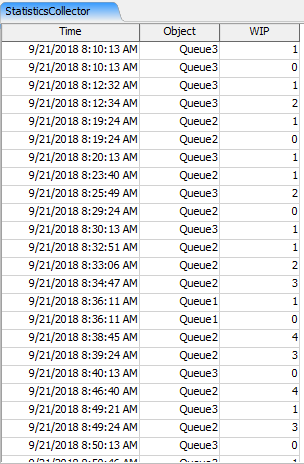
The table would look something like this:
If you cannot find a template that meets your needs, you can also use a Statistics Collector directly.
Create an empty table, then with insert your data into the table by using different lines of code wherever needed. The different commands for adding rows and columns can be found by clicking the help tab at the top and then selecting FlexScript API reference, then scroll down and click Table and all the commands that you need are there with descriptions.
8 People are following this question.
