question

Victor Alejandro HT avatar image
0 Likes"
Victor Alejandro HT asked tannerp edited

One output value for 2 sinks in a dashboard

Hi all,

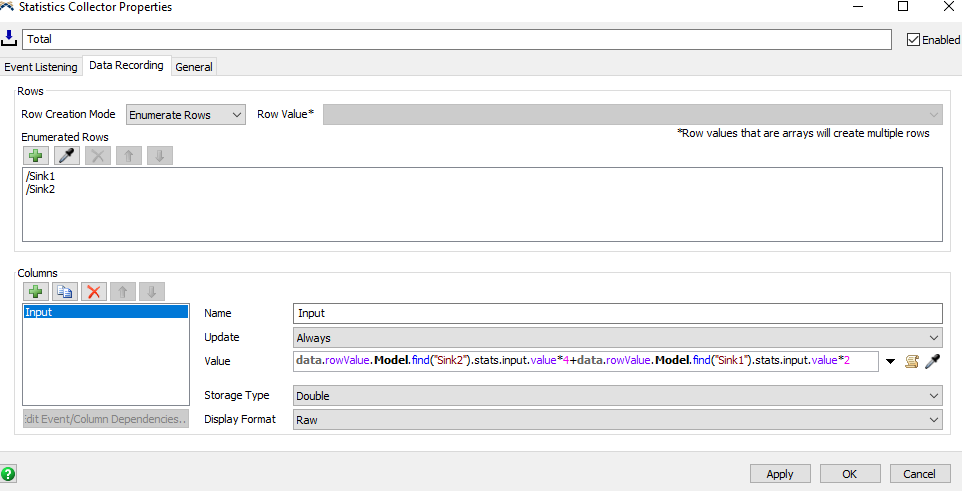
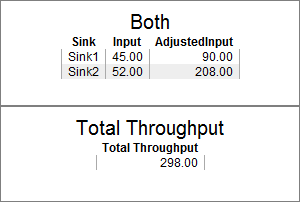
I want one single satistic for the sume of the input of 2 sinks. Every time there is an entry in sink1 the input value must be multiply by 2 and for the sink2 the input value must be multiply by 4 and I want the final sum of those inputs. I have tried with a modification of the statistic collector value with no sucess.

I attached the model.

suma-sinks.fsm

FlexSim 18.2.0
dashboardsstatistics collector
1.png (23.8 KiB)
suma-sinks.fsm (20.5 KiB)
5 |100000

Up to 12 attachments (including images) can be used with a maximum of 23.8 MiB each and 47.7 MiB total.

Jordan Johnson avatar image
1 Like"
Jordan Johnson answered Victor Alejandro HT commented

Here is an updated version of your model:

suma-sinks-updated.fsm

I added a label to both Sinks called Multiplier. I removed the Total collector, and replaced it with a collector called BothSinks. That collector shows the input of the sinks, as well as the adjusted input of the sinks, which takes the multiplier in to account. Finally, I added a Calculated Table that sums the adjusted input of both sinks.


suma-sinks.png (5.9 KiB)
· 1
5 |100000

Up to 12 attachments (including images) can be used with a maximum of 23.8 MiB each and 47.7 MiB total.

Victor Alejandro HT avatar image Victor Alejandro HT commented ·

Hi @jordan.johnson

Thanks for your answer this is exactly what I was looking for. I have never used a Calculated Table before. I wil check it out.

0 Likes 0 ·
Regan Blackett avatar image
0 Likes"
Regan Blackett answered Victor Alejandro HT commented

Is there A reason the Composite Throughput chart templates are insufficient?

Choose one of these and add the two sinks to the 'Objects' field and I think you'll get what you are looking for.


composite.png (9.6 KiB)
· 1
5 |100000

Up to 12 attachments (including images) can be used with a maximum of 23.8 MiB each and 47.7 MiB total.

Victor Alejandro HT avatar image Victor Alejandro HT commented ·

Hi Regan,

There is a reason composite charts are insufficient, because I need to multiply by a specific factor every time an item reaches a Sink. In other words the increment is not equal to the item input.

Perhaps I did not explain my self properly. Thanks for your reply.

1 Like 1 ·

Write an Answer

Hint: Notify or tag a user in this post by typing @username.

Up to 12 attachments (including images) can be used with a maximum of 23.8 MiB each and 47.7 MiB total.