question

Katie M avatar image
0 Likes"
Katie M asked Cliff King answered

How to make my Box Plot Y Axis in days?

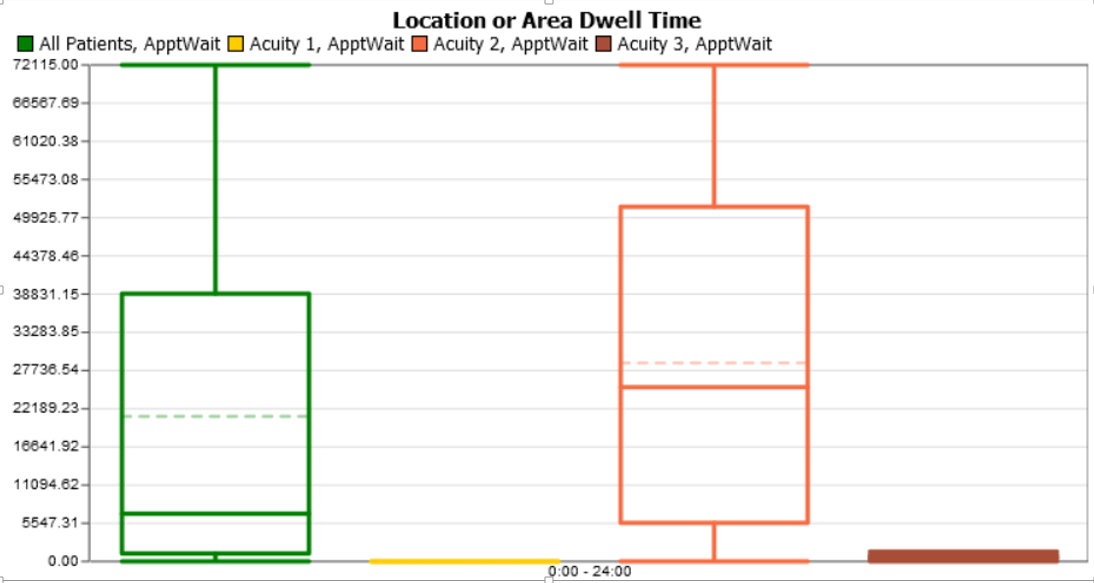
I've been using the box plot to show wait times in FlexSim, however, since the model runs in minutes, it is not clear in a presentation to use it this way. I would like my box plot to show the Y axis in Days. Is there a way to change this box plot y axis?

FlexSim HC 5.3.8
dashboard displaybox plots
box-plot.png (77.9 KiB)
5 |100000

Up to 12 attachments (including images) can be used with a maximum of 23.8 MiB each and 47.7 MiB total.

1 Answer

·
Cliff King avatar image
0 Likes"
Cliff King answered

Unfortunately there is not a way to change the units in the graph. This is something we will allow in the 2019 version, but not in the current version.

5 |100000

Up to 12 attachments (including images) can be used with a maximum of 23.8 MiB each and 47.7 MiB total.

Write an Answer

Hint: Notify or tag a user in this post by typing @username.

Up to 12 attachments (including images) can be used with a maximum of 23.8 MiB each and 47.7 MiB total.