question

Nicolas Mbz avatar image
0 Likes"
Nicolas Mbz asked Jeanette F commented

How to create Utilization box plot per type of ressource and per day

Hi !
I would like to have an utilization rate indicator per group of type of ressource and per day.
1) Is there something existing ?

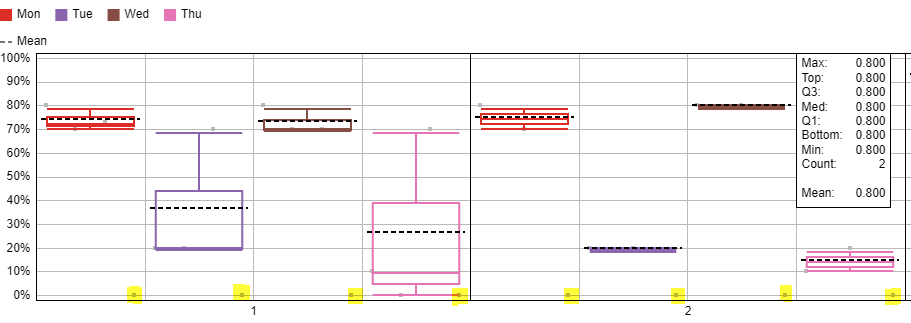
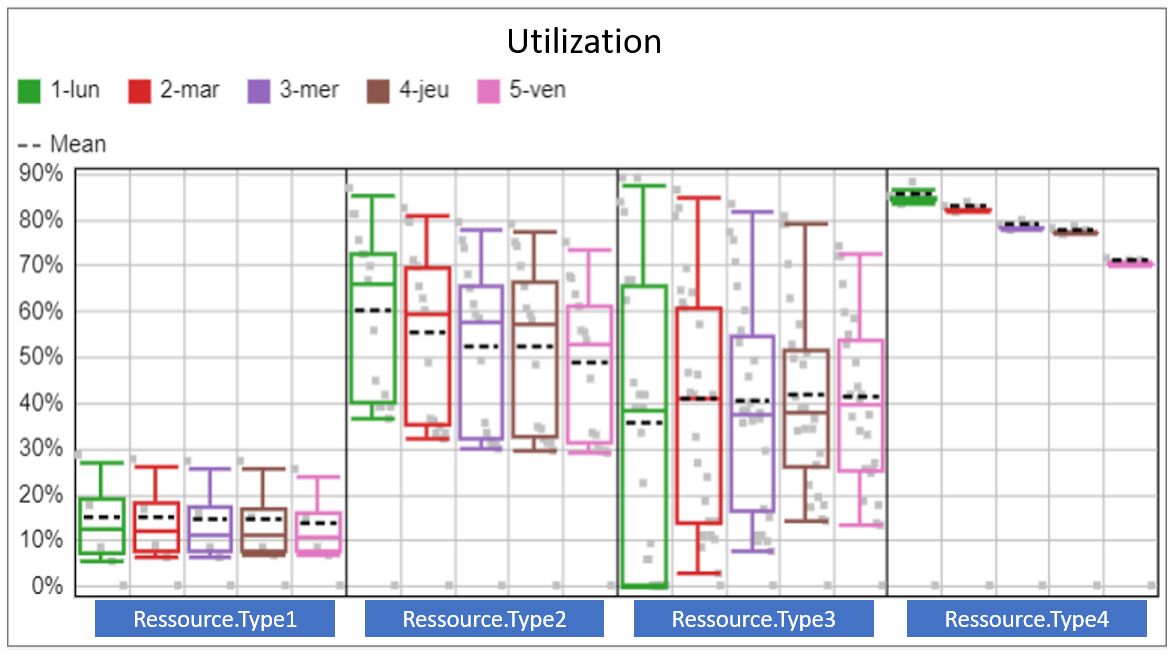
2) If not, I imagined something with a boxplot

Where each point is the utilization rate of one ressource per day (x split by Type, color split by day).

1720167192907.png

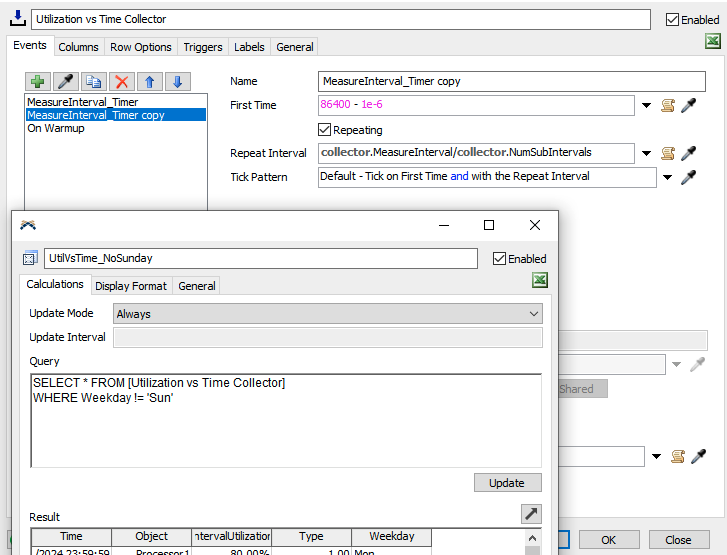
How to create the statistics collector for this blox plot ?

Thanks in advance

Here a model to try...

BasicProcessorsModel.fsm

FlexSim 23.2.3
statistics collectorutilizationbox plots
5 |100000

Up to 12 attachments (including images) can be used with a maximum of 23.8 MiB each and 47.7 MiB total.

1 Answer

Felix Möhlmann avatar image
0 Likes"
Felix Möhlmann answered Jeanette F commented

No there is nothing like this currently available as a premade chart in Flexsim.

You can build this yourself quite quickly if you start out with the Utilization vs. Time collector shown here. After adding it to the model and editing its labels to the correct values (group of objects, state table, one measurement per day), you only need to add columns to denote the type of the object and the week day.

basicprocessorsmodel-fm.fsm


· 4
5 |100000

Up to 12 attachments (including images) can be used with a maximum of 23.8 MiB each and 47.7 MiB total.

Nicolas Mbz avatar image Nicolas Mbz commented ·

Hi @Felix Möhlmann , Thanks a lot for your answer. That's very clos that what I need.

Understanding this SC (and SC in general) is a catastroph for me. I tried to modify myself but without succes.

1) Model start at Monday 00:00:00 and finish Saturday 00:00:00 (5 exact days).

> How to do for having the measures from Monday to Friday ? (Without Sunday and with Friday)

2) Some points are at 0% while the gantt shows that no ressource is used at 0% (on Monday for exemple).

> Why ?


1720190899359.png

1720190946739.png

0 Likes 0 ·
Felix Möhlmann avatar image Felix Möhlmann Nicolas Mbz commented ·

1) With how the collector is designed the initial event at time 0 has to happen to initialize the row label that keeps track of the total utilized time of the objects. So the "Sunday" data must be collected. But you can use a Calculated Table to filter them out later.

To include the Friday, other than running the model for a tiny amount of time past midnight, you can make the inital event non-repeating and add a copy of it that is which fires just ahead of midnight each day.

1720192799260.png

basicprocessorsmodel-fm_1.fsm

2) Your pictures didn't upload but I assume you are talking about these points?

1720193001367.png

I have no clue why they are there. They are not part of the collected data. And they only appear after the thursday measurement. So I guess it is some quirk/bug with the box plot chart. The same points appear in your example screenshot in the question.

0 Likes 0 ·
Nicolas Mbz avatar image Nicolas Mbz Felix Möhlmann commented ·

Hi @Felix Möhlmann

1) Ok that fits my need, thanks a lot

2) You're right, these points are showed but are not from de data. Is it a bug to fix @Jordan Johnson ?

Thanks !

0 Likes 0 ·
Show more comments