question

Mischa Spelt avatar image
1 Like"
Mischa Spelt asked Mischa Spelt commented

Chart template for tracked variable

Hi,

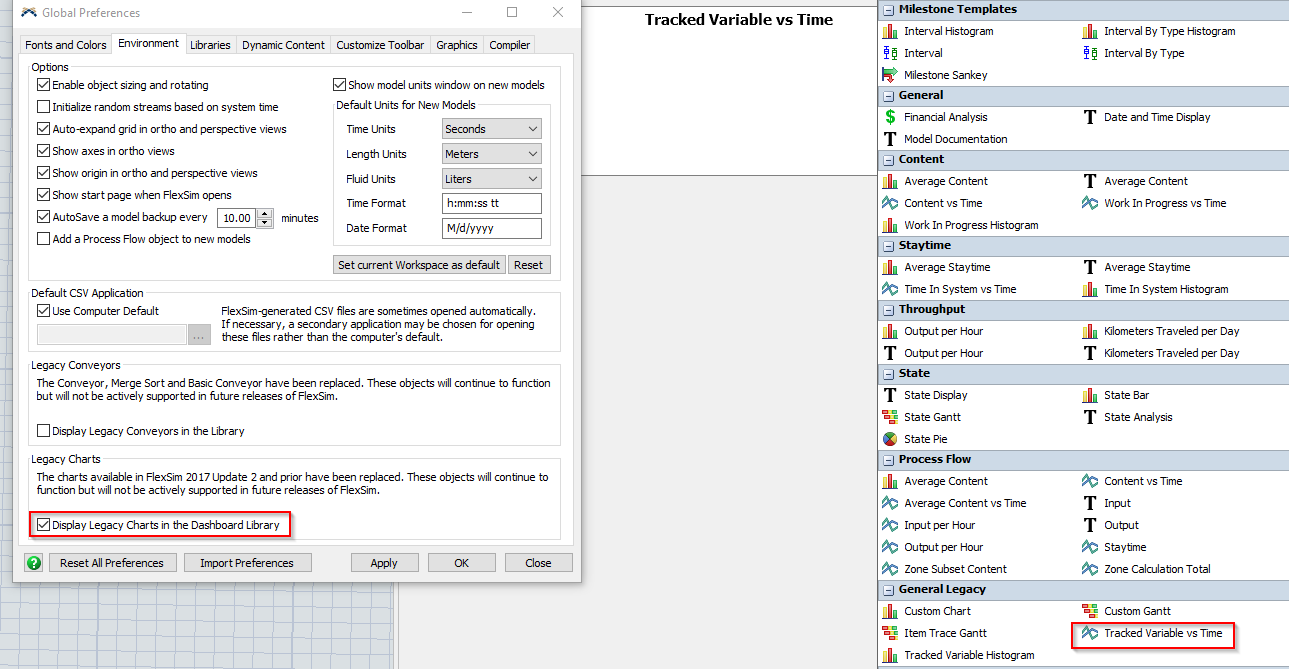
I was wondering how I can quickly plot the value of a tracked variable vs. time in a dashboard.

Of course I can make a Statistics Collector that listens to the On Change of the tracked variable, give it two columns, create a time plot, attach it to the Stats Collector and change the series type to Line; but that sounds like the sort of thing that would already be in the library somewhere.

FlexSim 19.0.2
dashboardstracked variableschart templates
5 |100000

Up to 12 attachments (including images) can be used with a maximum of 23.8 MiB each and 47.7 MiB total.

1 Answer

·
Joshua S avatar image
2 Likes"
Joshua S answered Mischa Spelt commented

It is, but it's a legacy chart, that is why it doesn't show up as an option. Below shows how to bring it up.


pic1.png (85.4 KiB)
· 1
5 |100000

Up to 12 attachments (including images) can be used with a maximum of 23.8 MiB each and 47.7 MiB total.

Mischa Spelt avatar image Mischa Spelt commented ·

Thanks Joshua. I try not to use the Legacy Charts as "legacy" to me sounds like "deprecated" but I understand that it's fine and actually the recommended solution in this case?

1 Like 1 ·

Write an Answer

Hint: Notify or tag a user in this post by typing @username.

Up to 12 attachments (including images) can be used with a maximum of 23.8 MiB each and 47.7 MiB total.