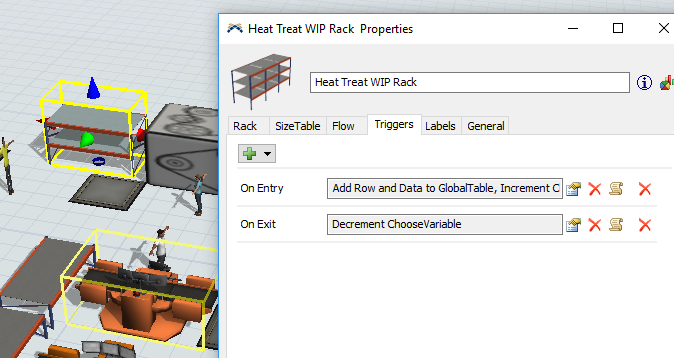
I have tracked variables that increments entering a WIP rack and decrements exiting, on 2 different WIP racks. I wanted to put both of these tracked variables on the same graph. I pinned one of them to a dashboard, but wondering how to maybe put the second one in there?
Graph multiple tracked variables in one chart?
FlexSim 19.0.2
You can also use a StatisticsCollector object to listen to all 3 tracked variables to put them on a single chart.
The example model I posted in this question does that.
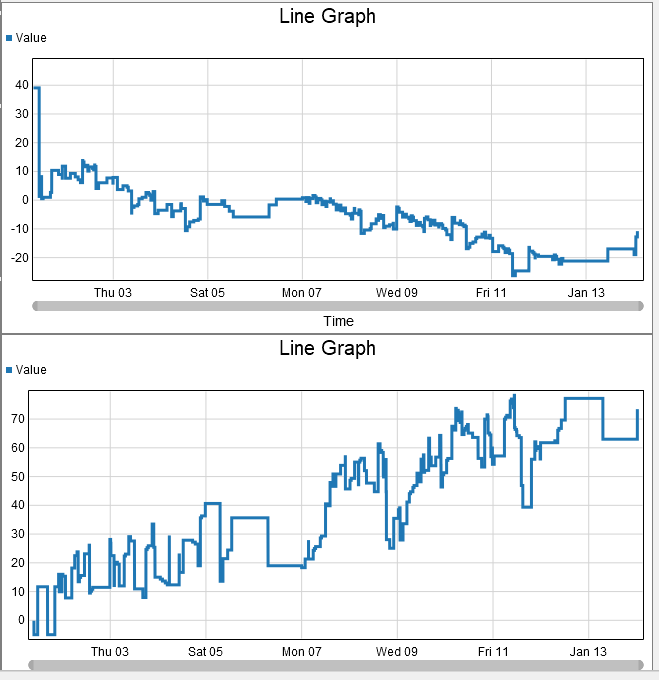
@Joshua S @phil.bobo, still not sure why from this model the tracked variable HT WIP Hrs and Inspection WIP Hrs go negative when the model hits January? do variables reset then?
You should change the Type on your tracked variables from Cumulative (e.g., Input/Output; i.e., values that always go up) to Level (e.g., Content; i.e., values that go up and down).
See Tracked Variables.
You have a warmup time defined in your model as 7 AM on 1/1/2019:
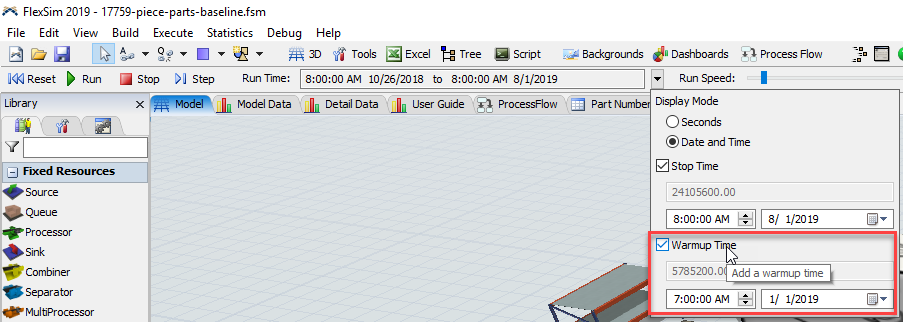
Uncheck that box if you do not want the stats to be reset at that time.
To get 2+ tracked variables to graph together, go to Global preferences, and in the Environment tab toggle the button for "display legacy charts in the dashboard Library". Then it will allow you to add a tracked variable vs time graph, and you can select as many tracked variables as you want. Which variable is the one that goes to zero?
Ok, I will check that out! So the HT WIP variable was the one that once it hit January it goes from like 40 hrs to 0 and then into the negatives....not sure why
8 People are following this question.