question

ernesto daniel AG avatar image
0 Likes"
ernesto daniel AG asked ernesto daniel AG commented

how to graph two segments in one pie chart from a statistic collector data?

Hello everyone, I have a problem when plotting two sectors in a pie chart.

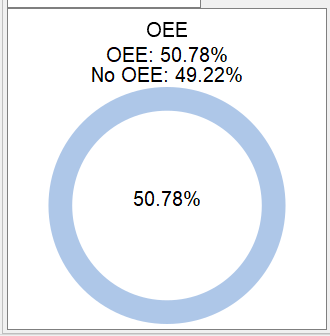
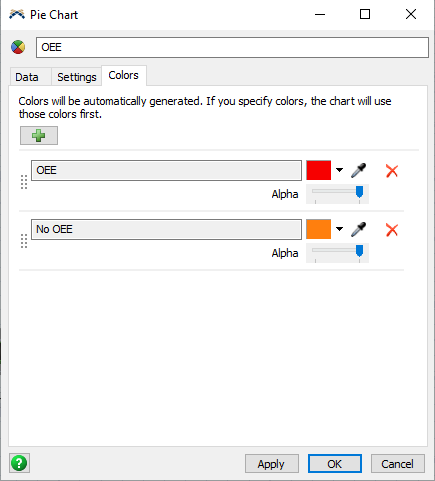
I would like the "OEE" and "No OEE" factors to be plotted together in a single pie chart, one of one color and the other of another color

The information comes from a statistic collector that I made.

How could I do that?

I hope you can help me

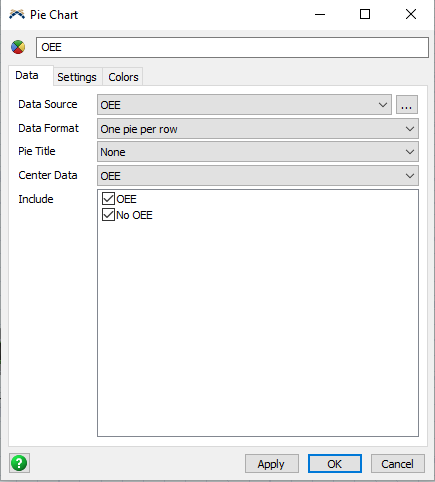
next I shared the model I made and an image of how the pie chart comes out.

oee-model.fsm

FlexSim 18.2.3
FlexSim 18.1.2
pie chart
oee.png (9.5 KiB)
oee-model.fsm (25.5 KiB)
5 |100000

Up to 12 attachments (including images) can be used with a maximum of 23.8 MiB each and 47.7 MiB total.

1 Answer

·
Benjamin W2 avatar image
1 Like"
Benjamin W2 answered ernesto daniel AG commented

Hi @ernesto daniel AG,

It looks like in the Pie Chart properties, you have the Data Format field set to "one segment per row". Switch this to "One pie per row". I would also suggest going to the Colors tab and deleting all of the excess colors.

oee-model.fsm


pie-chart-model.png (11.1 KiB)
colors-tab.png (13.2 KiB)
oee-model.fsm (113.4 KiB)
· 1
5 |100000

Up to 12 attachments (including images) can be used with a maximum of 23.8 MiB each and 47.7 MiB total.

ernesto daniel AG avatar image ernesto daniel AG commented ·

thank you so much, that was exactly that i was looking for

0 Likes 0 ·

Write an Answer

Hint: Notify or tag a user in this post by typing @username.

Up to 12 attachments (including images) can be used with a maximum of 23.8 MiB each and 47.7 MiB total.