I have some charts in my dashboard that I want to export. In the dashboard itself, you can just right click on the chart you want and you can choose export to csv, HTML or png but I want to do this using the experimenter. If I run the experimenter, I can access my dashboard charts via 'Performance Measure Results -> Dashboard Statistics', but there I don't see an option to export my graphs (and I can also not just right click on my charts). So how can I do this?
On the Experiment Results window, select Generate Report > Interactive Report Builder using the button at the bottom.
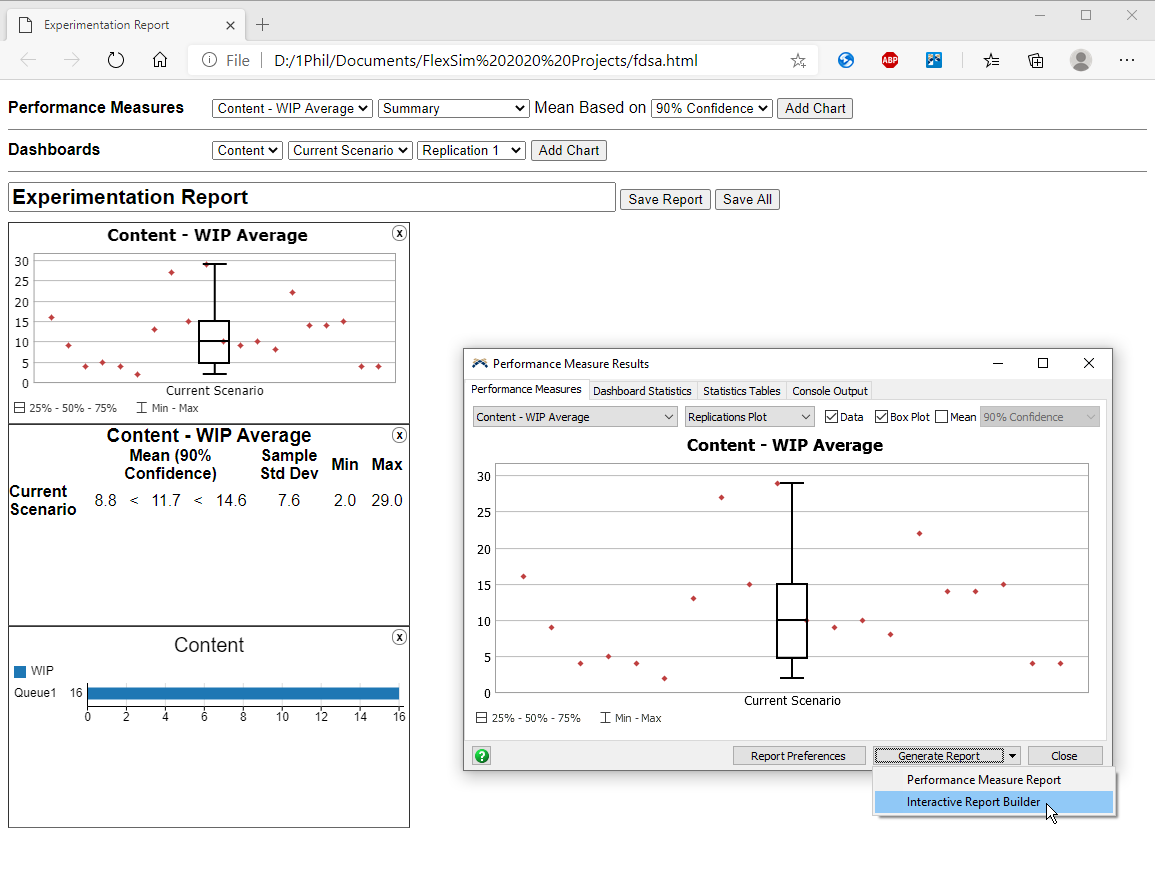 In the resulting html page, you can add the performance measure result charts and any saved dashboard charts to a report and then save that report as another HTML page.
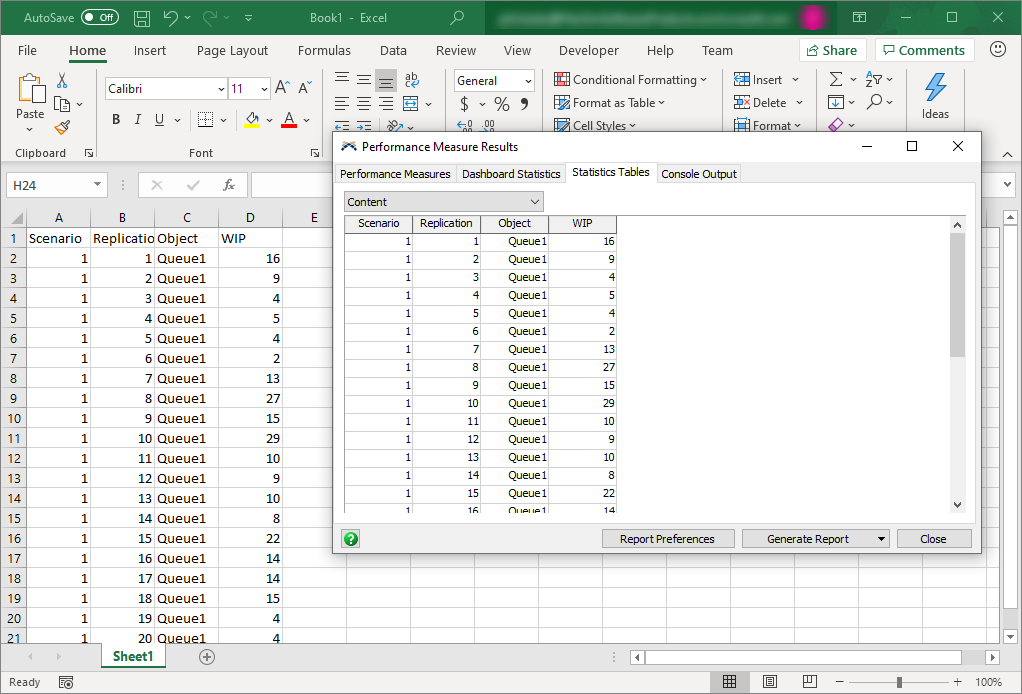
If you want just the raw data, you can also copy/paste it from the Statistics Tables tab:
16 People are following this question.
