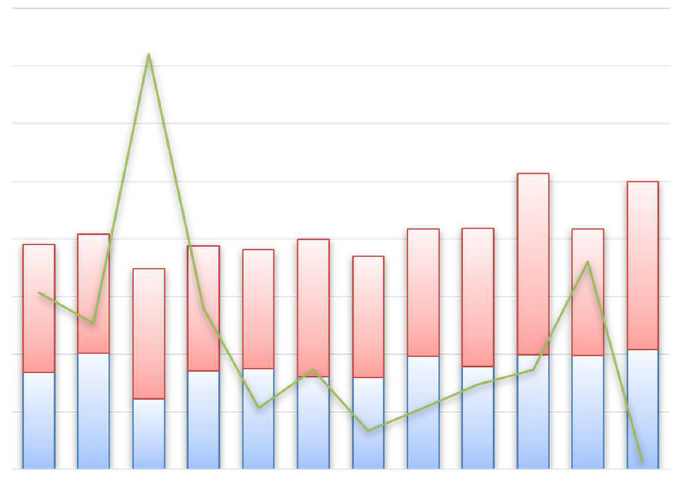
Is it possible to display two types of graph in one chart like below? In below example, bar graph and line graph are in one chart.
That kind of chart is not currently available in FlexSim. I can add a request to the dev list for that.
@Jordan Johnson Thank you for your reply! I just wanted to know if it's possible.
14 People are following this question.
FlexSim can help you understand and improve any system or process. Transform your existing data into accurate predictions.
FlexSim is a fully 3D simulation software environment. FlexSim can be used to simulate any process in any industry.
FlexSim®, FlexSim Healthcare™, Problem Solved.®, the FlexSim logo, the FlexSim X-mark, and the FlexSim Healthcare logo with stylized Caduceus mark are trademarks of FlexSim Software Products, Inc. All rights reserved.