question

Maryam H2 avatar image
0 Likes"
Maryam H2 asked Eric M commented

Exporting Experimenter results to Excel

Hi everyone,

I have a couple of questions,

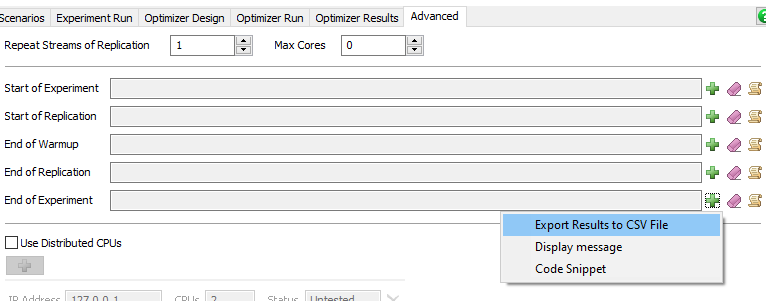
1. How I can export Experimenter data (with as much detail as possible) for all replications to an Excel file? Please also advise how I can export that from the tree?

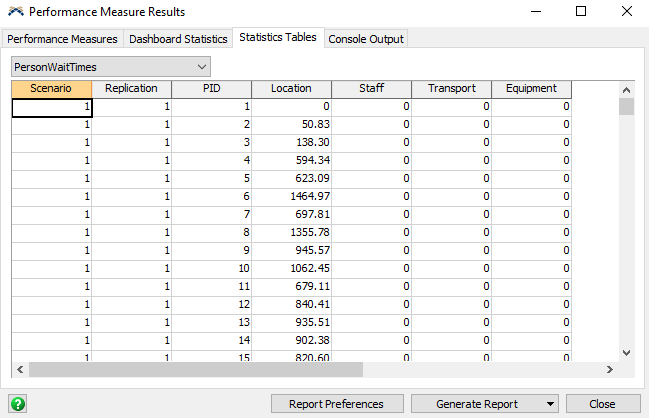
2. How I can export the data of a scenario chart in the dashboard to CSV (from multiple replications, not the aggregated one)?

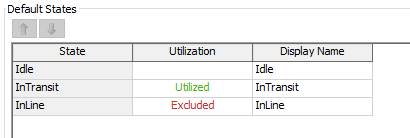
3. How I can get access to this tab "The Utilization Analysis Tab" so I can better understand how utilization rates in the utilization combined chart are calculated. The link to the tab in the documentation is: https://docs.flexsim.com/en/21.1/Reference/Tools/Legacy/LegacyDashboardGraphs/LegacyDashboardGraphs.html#utilization

Thanks!

FlexSim 21.1.3
flexsim healthcareutilizationflexsim 21.1.3export dataexporting dashboard
5 |100000

Up to 12 attachments (including images) can be used with a maximum of 23.8 MiB each and 47.7 MiB total.

1 Answer

·
Eric M avatar image
1 Like"
Eric M answered Eric M commented

1. In the Experiment Run tab check the box "save statistics data for each replication." Then in the Advanced tab at the End of Experiment click the "export results to CSV File" dropdown option. This will save the data for each replication as a CSV file that can be opened in Excel.

1623430128123.png

2. After clicking on View Results, go to the Statistics Tables tab. You can copy and paste this data into an excel file as well.

3. You can see and change the activities that are counted in the utilization calculation by clicking on People Settings in the toolbox. Utilization is calculated by finding the total time spent in states marked as 'utilized' divided by the total time spent in all states that aren't marked 'excluded.' So fields left blank are included in the calculation as 'unutilized' times. Another nice resource is to look at the Data section of the properties of the chart. You can view the tables that are used in making the calculations.

1623430364978.png


1623430128123.png (25.3 KiB)
1623430364978.png (5.9 KiB)
· 2
5 |100000

Up to 12 attachments (including images) can be used with a maximum of 23.8 MiB each and 47.7 MiB total.

Maryam H2 avatar image Maryam H2 commented ·

Thanks, @Eric M!

Is there any way to export all data for each patient and for all the replications? What I see in the Excel file is just the data for the performance measures for each scenario/replication. But I was wondering if I can get access to the data of all patients (one by one) for all charts I set up in the dashboard.

0 Likes 0 ·
Eric M avatar image Eric M Maryam H2 commented ·

The data for patients are stored in the People Statistics Tables in the toolbox. As far as I understand it, these are all independent of each other meaning there's not one place that stores all patient data. This makes it a little difficult to export all of it. I'm trying to find a solution that would allow you to select which stats tables you want to export and then have that data exported after each replication.


Until then, you have access to the different stats tables in the experimenter results window under the Statistics Tables tab that you can copy and paste (of course, this isn't ideal. Hopefully this at least gives you something for now, though). In the dropdown, you'll see a number of different Person tables that contain patient specific information for each scenario / replication (there's also data for staff, location, transport etc.). You'll also see the dashboard charts in the dropdown, but these generally just give the overall data instead of the patient specific data. You can see which Stats Tables a specific chart references by checking the Data section of the chart's properties. Here's what the window looks like of something you might copy and paste:

1623699810939.png

0 Likes 0 ·
1623699810939.png (25.5 KiB)

Write an Answer

Hint: Notify or tag a user in this post by typing @username.

Up to 12 attachments (including images) can be used with a maximum of 23.8 MiB each and 47.7 MiB total.