question

Leah R avatar image
0 Likes"
Leah R asked Leah R commented

How can I get the average total patient waiting time ?

Hi !

I'm using the experimenter to study patient waiting time over different scenarios.

By design, patients only have to wait for staff of for location.

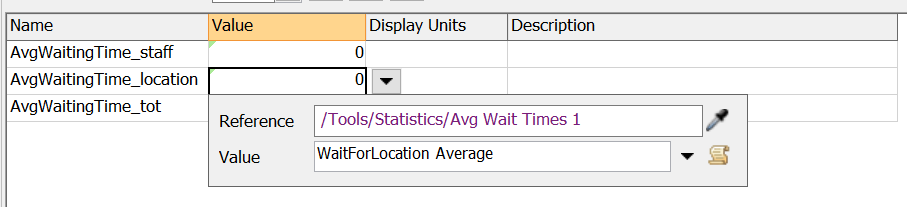
I managed to get the average patient waiting time for staff and for location thanks to the dashboard library (see next figures). However I could not find the average total patient waiting time since I don't think there is a graph dedicated to it. I cannot get through the average time in state graph since it's in percentage and not minutes like I would like it to be.

1648631201216.png

1648631168957.png
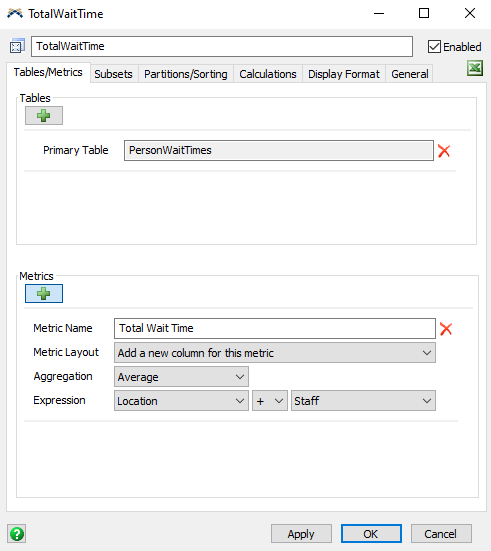
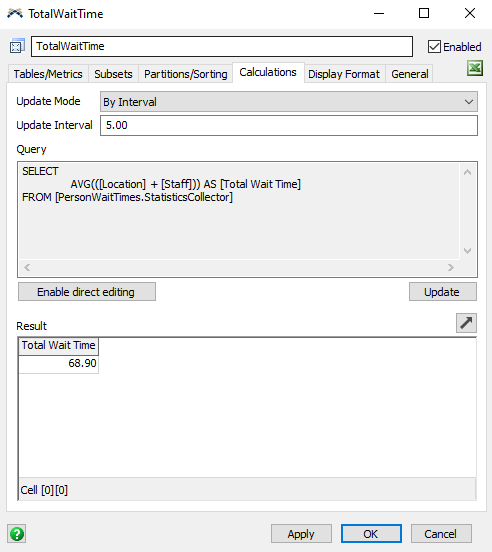
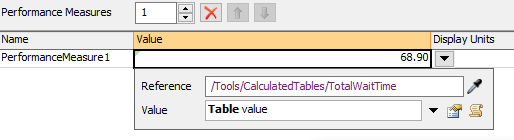
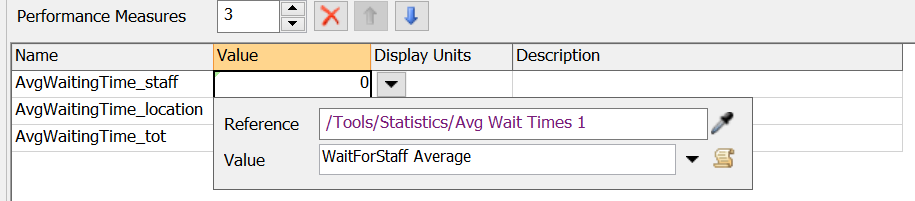
How can I get the average total patient waiting time in the performance measures table ?


Thanks in advance,

Leah

FlexSim 21.0.10
experimenterperformance measurespatient waiting time
1648631168957.png (22.9 KiB)
1648631201216.png (19.1 KiB)
5 |100000

Up to 12 attachments (including images) can be used with a maximum of 23.8 MiB each and 47.7 MiB total.

1 Answer

·
Felix Möhlmann avatar image
1 Like"
Felix Möhlmann answered Leah R commented

The dashboard chart you mention uses a calculated table to read the data from the "PersonWaitTimes" people table. You can do the same for the total waiting time.

Add a calculated table in the toolbox, then choose "PersonWaitTimes" as the primary table and add a new metric with the option "Basic math operations -> Aggregated operation on two columns". The aggregation should be the average and the columns location and staff.

1648635662328.png

The necessary SQL query will be automatically generated and can be seen in the "Calculations" tab. There you should also change the update mode to do this calculation in a fixed interval (or even "always").

1648635677202.png

You can then reference the table in the performance parameter and read the value in cell [1][1], which will be your desired total.

1648635692460.png

You can also add the other individual values as columns to this calculated table so you don't need the "detour" through the dashboard charts.

TotalWaitTime.fsm


1648635662328.png (25.4 KiB)
1648635677202.png (24.7 KiB)
1648635692460.png (11.1 KiB)
totalwaittime.fsm (150.1 KiB)
· 1
5 |100000

Up to 12 attachments (including images) can be used with a maximum of 23.8 MiB each and 47.7 MiB total.

Leah R avatar image Leah R commented ·

Thank you very much, its works !

0 Likes 0 ·

Write an Answer

Hint: Notify or tag a user in this post by typing @username.

Up to 12 attachments (including images) can be used with a maximum of 23.8 MiB each and 47.7 MiB total.