question

Jay K9 avatar image
0 Likes"
Jay K9 asked Jason Lightfoot edited

How to create a state chart for created object task executor?

I am using process flow to create a task executor at a control point and making it travel to another control point before destroying it.

I want to get a state chart for those task executor. Is it possible to do that?

FlexSim 21.0.10
taskexecutorcreate objectstate chart
· 1
5 |100000

Up to 12 attachments (including images) can be used with a maximum of 23.8 MiB each and 47.7 MiB total.

Jason Lightfoot avatar image Jason Lightfoot ♦ commented ·

Bar or gantt state chart?

0 Likes 0 ·
Jason Lightfoot avatar image
2 Likes"
Jason Lightfoot answered Jason Lightfoot edited

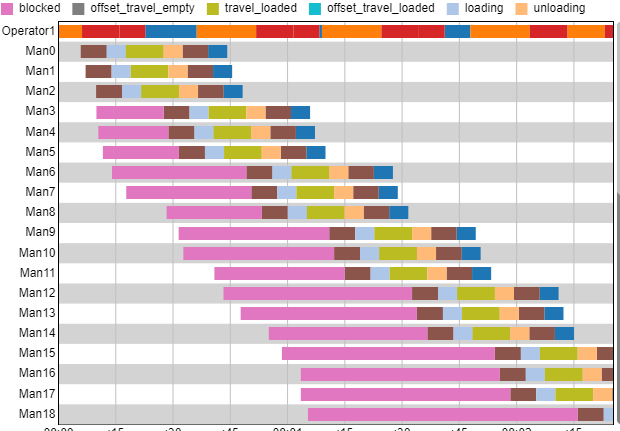
Here's an example of a state gantt by adding listeners to process flow activities detecting state change (based on the standard state gantt - at the moment the keys are different).

1677575814387.png

StateChartDynamicAGV2.fsm


· 5
5 |100000

Up to 12 attachments (including images) can be used with a maximum of 23.8 MiB each and 47.7 MiB total.

Felix Möhlmann avatar image Felix Möhlmann commented ·

For a bar chart, here's a model that uses a Statistics Collector that works similar to how the default state bar collector in later versions works.

You have to define which states it will track (by number in profile) in the "StateTable" bundle label.

1677585866864.png

FlowItemStateChart_fm.fsm

1 Like 1 ·
Jay K9 avatar image Jay K9 Felix Möhlmann commented ·
Can I do this to get blocked state and moving state?
0 Likes 0 ·
Felix Möhlmann avatar image Felix Möhlmann Jay K9 commented ·

You can choose to track any default state by including it in the "StateTable" label. Each state has a define in the format "STATE_XYZ" to get its number. You can type it in the script console to view the value. For example "blocked" has the number 4.

1677607210251.png

The display name is whatever you choose in the second column.

1677607292097.png

1677607303737.png

If you want to combine multiple default states into one value then you would have to alter the label to contain a "normal" table instead of a bundle, so it can hold array values. Then use arrays of possibly more than one value in the first column and sum up the times for each respective state in the "Time" and "Utilization" columns of the Statistics Collector.

0 Likes 0 ·
1677607210251.png (4.9 KiB)
1677607292097.png (3.4 KiB)
1677607303737.png (19.9 KiB)
Jay K9 avatar image Jay K9 commented ·
Is it possible to do this without having operator1?
0 Likes 0 ·
Jason Lightfoot avatar image Jason Lightfoot ♦ Jay K9 commented ·

You should be able to remove it from the Group: 'State Gantt Objects'.

1 Like 1 ·
Long G avatar image
1 Like"
Long G answered

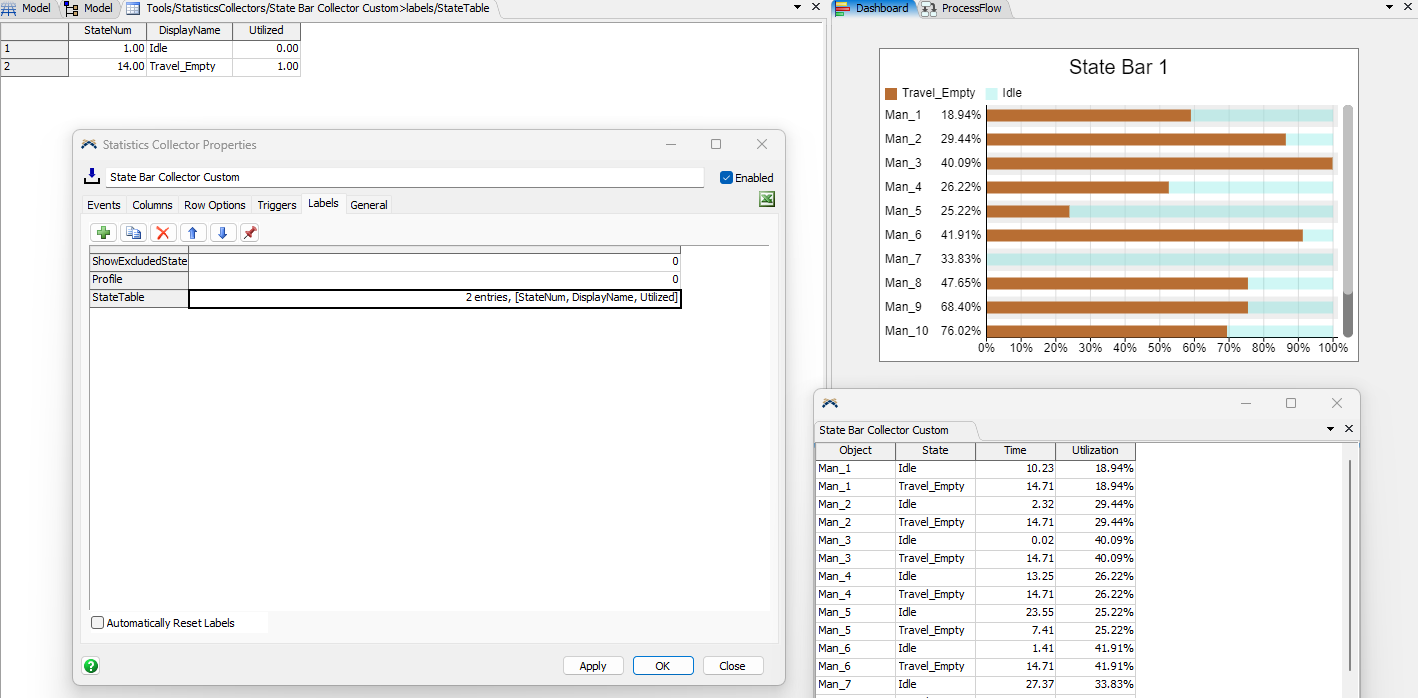
I think this process will be ok :1.Use stats.state().profile[][] and other code to save useful data into GlobalTable; 2. Use CalculatedTable to calculate or only as an intermediate step. 3.Use Base Chart Types to show these data.

I am not familiar with CalculatedTable ,but i don't think StatisticsCollector is the availabel methods to get data from GlobalTable .The above process is the only way I can think of since resetting will affect the setting value of the chart.

5 |100000

Up to 12 attachments (including images) can be used with a maximum of 23.8 MiB each and 47.7 MiB total.

Write an Answer

Hint: Notify or tag a user in this post by typing @username.

Up to 12 attachments (including images) can be used with a maximum of 23.8 MiB each and 47.7 MiB total.