question

Estephe DLDL avatar image
0 Likes"
Estephe DLDL asked Joseph Gillespie edited

Formulas for calculation

modele-memoire-sem1.fsm

Hello everyone,

Recently I have been working on a model, and I have faced some conclusions that I do not understand. Basically, I run a model where a patient has a room assigned to him directly, and then I run exactly the same model, but without that room assigned and the operation can go in whatever room is available.
I would like to analyze the utilization of the room, and to analyze it from 8h to 16h which is the normal hours and from 16h to midnight which are additional hours. Normally, I would expect that from 4 to midnight my room are less utilized as in general they are more available, so everyhting should finish earlier as another graph is saying, so my utilization rate for that period of time should be lower also, but the opposite is happening.
Could you please advise on this ?

I have shared the model.

Also, do you have any table with how numbers are calculated ? It would help me to understand some changes for my analysis as I do not see a place where i can find them.

Thanks,

Estephe de Lussac

utilizationcalculationformula
· 3
5 |100000

Up to 12 attachments (including images) can be used with a maximum of 23.8 MiB each and 47.7 MiB total.

Clair A avatar image Clair A commented ·

To help us understand your question, could you please add screenshots of the graphs you compare ? Or share the 2 different versions of your model for which you get different results ?

0 Likes 0 ·
Estephe DLDL avatar image Estephe DLDL Clair A commented ·

Hello,

Attached you can have the 2 differents models if you want. Also I have attached a word document with the graphs for the two scenarios.

I have an idead maybe that could explain, in the model in the first message, a room is assigned to each operation, sometimes it is not open for a day, but it is a specific room that is not open. In my seconde model, this one, as rooms are not assigned, what I have done for the availability is I do not care which room it is, I need for example 6 rooms monday, 5 tuesday, 3 wednesday, so in this model I will havec 3 rooms that will operate from monday to Wed, 2 others on monday and tuesday and only one more on monday, the availability consideration is different than in the first scenario (not the same rooms are available). This could affect the calculation ?

But basically, I would except on the second model these numbers to be lower, as rooms are more available, they should work less than in the first scenario for the same amount of operation (and time of operation) but according to graphs, they are higher...

I think you will understand better if you look at the scenario and when rooms are available.

graphs-room-assigned-or-not2.pdf

modele-memoire-sem1-sp.fsm

0 Likes 0 ·
Joseph Gillespie avatar image Joseph Gillespie commented ·

@Estephe DLDL

Was Clair's answer helpful for you? Do you have any more questions?

0 Likes 0 ·

1 Answer

·
Clair A avatar image
0 Likes"
Clair A answered Clair A commented

I think I understand better your question now, thanks. Let's take an example to illustrate how statistics are calculated. I ran your first model from 8am to 4pm.

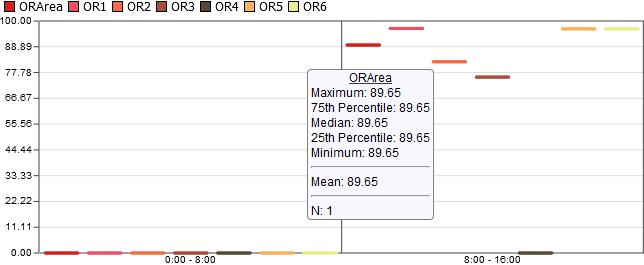
Here are the values of OR utilization between 8am and 4pm:

  • OR1: 96.80%
  • OR2: 82.44%
  • OR3: 75.81%
  • OR4: 0%
  • OR5: 96.59%
  • OR6: 96.59%
  • ORArea: 89.65%

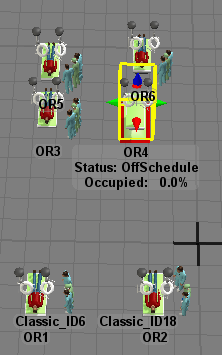
During these 8 hours, OR4 was 100% in the state OffSchedule:

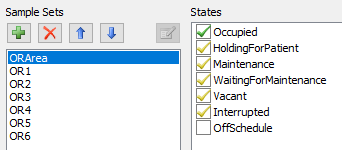
In the properties of your graph, the state OffSchedule is by default excluded from the calculation:

So if you double check the result, the utilization of ORArea is:

utilization of (OR1 + OR2 + OR3 + OR5 + OR6)/5 = (96.80 + 82.44 + 75.81 + 96.59 + 96.59)/5 = 89.65%

It's as if you had 5 rooms in your area since OR4 was OffSchedule all this time.

If you include the state OffSchedule in the calculation:

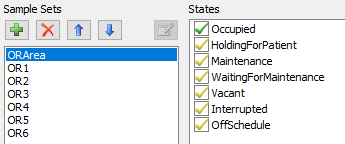
Then the mean utilization of ORArea is 74.71%:
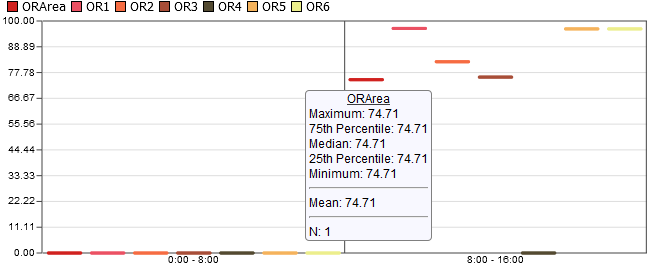
Double check:

utilization(OR1 + OR2 + OR3 + OR4 + OR5 + OR6)/6 = (96.80 + 82.44 + 75.81 + 0 + 96.59 + 96.59)/6 = 74.71%

Based on your question, I assume it would make more sense for you to include the state OffSchedule in your statistical analysis.


3.png (7.5 KiB)
2.png (36.2 KiB)
4.png (7.5 KiB)
1.png (9.9 KiB)
5.png (9.7 KiB)
· 2
5 |100000

Up to 12 attachments (including images) can be used with a maximum of 23.8 MiB each and 47.7 MiB total.

Estephe DLDL avatar image Estephe DLDL commented ·

Hello Clair,

I thought about this, my objective is not really to look at if the room is closed how much we lose, it is really to see with the rooms opened, what happened. And my concern is not from 8 to 4, but really from 4 to midnight. Because it the model where a room is assigned, maybe 5 rooms will be used on this time horizon because it has to be that room and not another one, but when room is not assigned, it is possible that during the day we have avoided some late, and that at 4 you only have 4 rooms that are being used, but it does not mean that the room is offscheduled because it can be used. And my question is, in that case, will it be counted in the calculation as a 0 or not ? Because in that particular case it should because the room is open, just not used, but it is not offscheduled officially...

I ask this because when you take the model, with room assigned, you have 14.46% over the week of utilization for rooms from 4 to midnight, but when you just say in the process that patient goes in OR area so whatever room, I finish with 14.64, but it is bot logical, and the problem I am pointed is the only answer I have to explain this.

0 Likes 0 ·
Clair A avatar image Clair A Estephe DLDL commented ·

The way statistics are calculated between 8am and 4pm is the same as between 4pm and midnight.

From what I understood in your model, I am not surprised that results are the same.

Whether you assign rooms or not, the average utilization between 8am and 4pm is the same in both scenarios.

And it's also the same average utilization in both scenarios between 4pm and midnight. From 14.46% to 14.64% the difference is almost nothing (1%), so I would not conclude that the utilization is increasing, for me it's the same.

0 Likes 0 ·

Write an Answer

Hint: Notify or tag a user in this post by typing @username.

Up to 12 attachments (including images) can be used with a maximum of 23.8 MiB each and 47.7 MiB total.